In week 4, we must brainstorm on some creative ideas to visualize and see an insight of data visualization. Data visualization plays a vital role in processing and analyzing data. The new era is of big data and the only way to get knowledge from data is through graphs and charts. So Processing is ideal as it allows us to manipulate and simulate the data and draw various graphs based on our own requirements.
INSPIRATION BEHIND DATA VISUALIZATION:
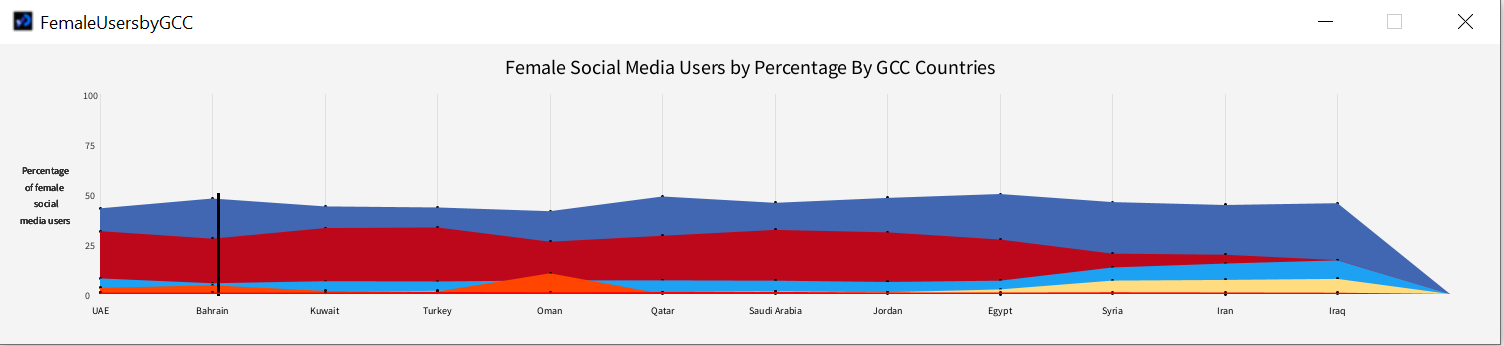
The idea comes into visualization by comparing Gulf countries in terms of female users on social media. There are numerous social media platforms, and, on every platform, we have number of active users by gender. Based on the above facts, I decided to visualize active female users on different social media platforms in different gulf countries. This stems from the fact that in previous generations, the society in the Middle East was more conservative in terms of allowing girls to engage and interact on social media. As a Middle Eastern woman, I found it to be interesting to statistically show how this mindset changed throughout recent generations. Google trends was a part of my research as it shows that females are more active on social media platforms rather than males.
CHALLENGES & PROBLEMS:
The generation of data for active female users on different social media platforms was challenging for me due to data ambiguity on the internet. Preprocessing of data was another challenge too. To sort out this issue, I converted csv format dataset into tab separated format to preprocess the values in a convenient way. It was difficult for me to find the maximum and minimum number of female active social media users from the data to draw graph points. The labeling was somehow easy but drawing area for each social media platform was a hurdle.
PROCEDURE:
Based on the previous knowledge of classes and object oriented, I started by implementing classes which supports me further to manage my code while visualizing the data. I implemented the dataset class and its main purpose was to read and preprocess the data before visualizing the data. The class contained some important attributes which further stored different values from the dataset.
class Dataset
{

  //Atribute for Number Of rows
  int NumberOfRows;
  //Attribute for Number of columns
  int NumberOfColumns;
  //2D array for getting social media users percentage data
  float[][] SocialData;
  //For getting name of rows
  String[] NameOfRows;
  //For getting GCC countries names
  String[] GCCCountries;
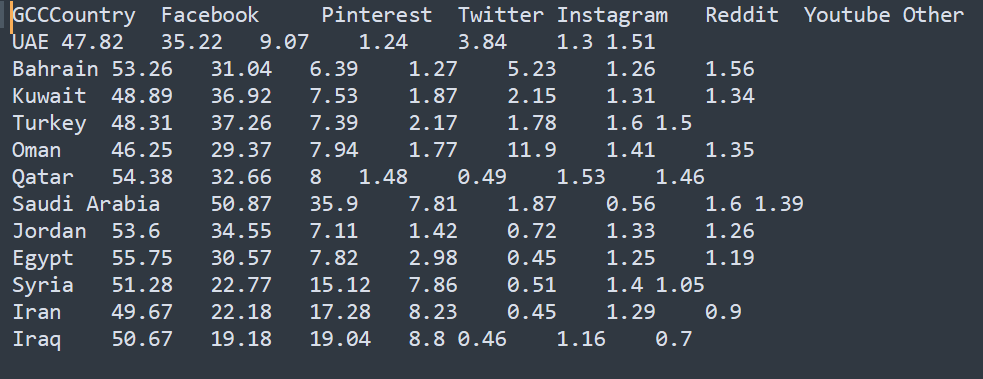
The dataset is in tabular format and is tab delimited. The first row contains column names. The first column contains GCC countries names. While the float values represent active social media female user’s percentage.
The dataset function is taking the file name as a parameter and loading all the lines in a string array. Then we further split it by tab and get the columns which is at first row. I store GCC Countries names in the class attribute named as GCCCountries. Then, did a preprocessing on the data present in the attributes to remove unnecessary spaces and quotations. By doing so, I got the number of columns and number of rows in this function.
//Function to read data from the tsv (Tab Seperated File) file
 //Parameter is filename
 Dataset(String filename)
 {
   //storing rows in string array
   String[] rows = loadStrings(filename);

   //Getting column names
   String[] columns = split(rows[0], TAB);
   //Getting GCC Countries Names
   GCCCountries = subset(columns, 1);
   //Pre processing on GCC Countries
   Preprocessing(GCCCountries);
   //for Countires Count
   NumberOfColumns = GCCCountries.length;

   //For name of each row
   NameOfRows = new String[rows.length-1];
   //For Social Data
   SocialData = new float[rows.length-1][];

   // We are ignoring first column as it containes headers
   for (int i = 1; i < rows.length; i++)
    {
     // Spliting row based on Tab
     String[] pieces = split(rows[i], TAB);
     //Pre processing on row data
     Preprocessing(pieces);

     // Getting row name
     NameOfRows[NumberOfRows] = pieces[0];
     // Getting social media users data
     SocialData[NumberOfRows] = parseFloat(subset(pieces, 1));

     // incrementing rows
     NumberOfRows++;
   }
   // adding more storage in social data varible
   SocialData = (float[][]) subset(SocialData, 0, NumberOfRows);
 }
In the preprocessing function, I am passing an array containing active social media female user’s percentage values. In other words, I am checking if the values are quoted, and then removing the quotes from the values.
// for pre processing the dataset. removing unecessary quotations and spacing
  void Preprocessing(String[] array)
  {
    for (int i = 0; i < array.length; i++)
    {
      if (array[i].length() > 2)
      {
        if (array[i].startsWith("\"") && array[i].endsWith("\""))
        {
          array[i] = array[i].substring(1, array[i].length() - 1);
        }
      }
      array[i] = array[i].replaceAll("\"\"", "\"");
    }
  }
Then we have small getter functions which returns class attribute values. These functions aid in the code reusability.
//For getting number of rows
 int getNumberOfRows()
 {
   return NumberOfRows;
 }

 //For getting row names
 String getRowName(int rowIndex)
 {
   return NameOfRows[rowIndex];
 }

 //for getting social media platform names
 String[] getNameOfRows()
 {
   return NameOfRows;
 }
Moving forward, I implemented the function to get which GCC country has the minimum active female social media users. I am passing the social platform index to check for minimum value.
//Getting the minimum number female users on social media platform
 float MinimumColumn(int col)
 {
   float m = Float.MAX_VALUE;
   for (int i = 0; i < NumberOfRows; i++)
   {
     if (!Float.isNaN(SocialData[i][col]))
     {
       if (SocialData[i][col] < m)
       {
         m = SocialData[i][col];
       }
     }
   }
   return m;
 }
Later, I calculated which GCC country has maximum active female social media users and passed the social media index as a parameter. Moreover, inside the for loop, I am checking if the new value is greater than previous one, then updating the temp m variable which contains maximum value.
//Getting the maximum number female users on social media platform
  float MaximumColumn(int col)
  {
    float m = -Float.MAX_VALUE;
    for (int i = 0; i < NumberOfRows; i++)
    {
      if (isValid(i, col))
      {
        if (SocialData[i][col] > m)
        {
          m = SocialData[i][col];
        }
      }
    }
    return m;
  }
Afterwards, I implemented maximum and minimum values based on social media platforms. Each GCC country has multiple social media platforms and, in these functions, calculation of which social media has minimum active female users and which has maximum social media users is done.
//Getting GCC Country which has lowest female users on social media platforms
  float MinimumRow(int row)
  {
    float m = Float.MAX_VALUE;
    for (int i = 0; i < NumberOfColumns; i++)
    {
      if (isValid(row, i))
      {
        if (SocialData[row][i] < m)
        {
          m = SocialData[row][i];
        }
      }
    }
    return m;
  }


//Getting GCC Country which has highest female users on social media platforms
float MaximumRow(int row)
{
float m = -Float.MAX_VALUE;
for (int i = 1; i < NumberOfColumns; i++)
{
if (!Float.isNaN(SocialData[row][i]))
{
if (SocialData[row][i] > m)
{
m = SocialData[row][i];
}
}
}
return m;
}
Next, I implemented class for social platform. This class supports in drawing areas and value points. In addition, I initialized attributes to store min and max values, countries count and social platforms count.
public class SocialPlatform
{

  //Initializing object of female users count on social media platforms by GCC countries
  Dataset FemaleUsers;

  //Attributes for maximum and minimum count
  float dataMin, dataMax;
  String datesMin, datesMax;

  // for number of rows and number of columns
  int rowCount, columnCount;
  int columnNumber;
  String GCCCountries[];

  // Attributes for plotting graphs
  float plotX1, plotY1, plotX2, plotY2;

  //For coloring the graph
  color hexcode;
The social platform function is drawing area on the screen for each social media platform with specified color. The color value and social media platform index is passed as parameter.
//function to draw social platform insight with color
  SocialPlatform(color hexcode, int columnNumber)
  {
  //saving the color of social platform
  this.hexcode = hexcode;
  //for column number
  this.columnNumber = columnNumber;

  //For female Social Media users
  FemaleUsers = new Dataset("SocialMediaUsersFemales.tsv");
  //for row and column count
  rowCount = FemaleUsers.getNumberOfRows();
  columnCount = FemaleUsers.getNumberOfColumns();

  //getting GCC country
  GCCCountries = FemaleUsers.getNameOfRows();
  //getting maximum and minimum value of female users on social media with respect to GCC Country
  datesMin = GCCCountries[0];
  datesMax = GCCCountries[GCCCountries.length-1];


  dataMin = FemaleUsers.MinimumTable();
  dataMax = FemaleUsers.MaximumTable();

  //How much gap from the left of the screen
  plotX1 = 50;
  //Gap from the top of the screen
  plotY1 = 150;
  plotX2 = width - plotX1;
  plotY2 = height - 50;

  DrawFemaleUsersPoints(this.columnNumber);
  DrawAreaofFemaleUsersbyMedia(this.columnNumber);
  mouseMoved();
}
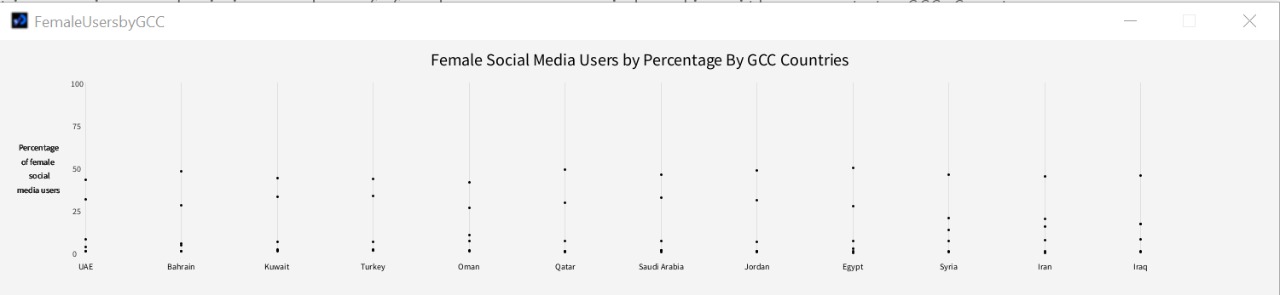
Here I am drawing points to show the active females social media users on graph. When the mouse hovers to the point, then the percentage value pops up with the social platform name.
In the main program, initializing objects for each social media platform is created. Then, I called relevant functions to draw areas and points of each social media platform.
In draw function, I initialized each social media platform with a different color. Drawing countries label and female users labels on x and y axis of graph.
void draw()
{
background(244);
title();
DrawGCCCountriesLabels();
DrawFemaleUsersLabel();
smooth();
facebook = new SocialPlatform(#4267B2, 0);
pinterest = new SocialPlatform(#BD081C, 1);
twitter = new SocialPlatform(#1DA1F2, 2);
instagram = new SocialPlatform(#FFDC80, 3);
reddit = new SocialPlatform(#FF4500, 4);
youtube = new SocialPlatform(#FF0000, 5);
}
COMPLETE CODE ATTACHED BELOW:
class Dataset
{
//Atribute for Number Of rows
int NumberOfRows;
//Attribute for Number of columns
int NumberOfColumns;
//2D array for getting social media users percentage data
float[][] SocialData;
//For getting name of rows
String[] NameOfRows;
//For getting GCC countries names
String[] GCCCountries;
//Function to read data from the tsv (Tab Seperated File) file
//Parameter is filename
Dataset(String filename)
{
//storing rows in string array
String[] rows = loadStrings(filename);
//Getting column names
String[] columns = split(rows[0], TAB);
//Getting GCC Countries Names
GCCCountries = subset(columns, 1);
//Pre processing on GCC Countries
Preprocessing(GCCCountries);
//for Countires Count
NumberOfColumns = GCCCountries.length;
//For name of each row
NameOfRows = new String[rows.length-1];
//For Social Data
SocialData = new float[rows.length-1][];
// We are ignoring first column as it containes headers
for (int i = 1; i < rows.length; i++)
{
// Spliting row based on Tab
String[] pieces = split(rows[i], TAB);
//Pre processing on row data
Preprocessing(pieces);
// Getting row name
NameOfRows[NumberOfRows] = pieces[0];
// Getting social media users data
SocialData[NumberOfRows] = parseFloat(subset(pieces, 1));
// incrementing rows
NumberOfRows++;
}
// adding more storage in social data varible
SocialData = (float[][]) subset(SocialData, 0, NumberOfRows);
}
// for pre processing the dataset. removing unecessary quotations and spacing
void Preprocessing(String[] array)
{
for (int i = 0; i < array.length; i++)
{
if (array[i].length() > 2)
{
if (array[i].startsWith("\"") && array[i].endsWith("\""))
{
array[i] = array[i].substring(1, array[i].length() - 1);
}
}
array[i] = array[i].replaceAll("\"\"", "\"");
}
}
//For getting number of rows
int getNumberOfRows()
{
return NumberOfRows;
}
//For getting row names
String getRowName(int rowIndex)
{
return NameOfRows[rowIndex];
}
//for getting social media platform names
String[] getNameOfRows()
{
return NameOfRows;
}
//for getting row index based on social media platform name
int getRowIndex(String name)
{
for (int i = 0; i < NumberOfRows; i++)
{
if (NameOfRows[i].equals(name))
{
return i;
}
}
return -1;
}
//for getting number of columns
int getNumberOfColumns()
{
return NumberOfColumns;
}
//for getting column name
String getColumnName(int colIndex)
{
return GCCCountries[colIndex];
}
//for getting GCC countries list
String[] getGCCCountries()
{
return GCCCountries;
}
//getting female social media users value which is in percentage as float value
float getFloat(int rowIndex, int col)
{
return SocialData[rowIndex][col];
}
//checking of the value is valid
boolean isValid(int row, int col)
{
if (row < 0)
{
return false;
}
if (row >= NumberOfRows)
{
return false;
}
if (col >= SocialData[row].length)
{
return false;
}
if (col < 0)
{
return false;
}
return !Float.isNaN(SocialData[row][col]);
}
//Getting the minimum number female users on social media platform
float MinimumColumn(int col)
{
float m = Float.MAX_VALUE;
for (int i = 0; i < NumberOfRows; i++)
{
if (!Float.isNaN(SocialData[i][col]))
{
if (SocialData[i][col] < m)
{
m = SocialData[i][col];
}
}
}
return m;
}
//Getting the maximum number female users on social media platform
float MaximumColumn(int col)
{
float m = -Float.MAX_VALUE;
for (int i = 0; i < NumberOfRows; i++)
{
if (isValid(i, col))
{
if (SocialData[i][col] > m)
{
m = SocialData[i][col];
}
}
}
return m;
}
//Getting GCC Country which has lowest female users on social media platforms
float MinimumRow(int row)
{
float m = Float.MAX_VALUE;
for (int i = 0; i < NumberOfColumns; i++)
{
if (isValid(row, i))
{
if (SocialData[row][i] < m)
{
m = SocialData[row][i];
}
}
}
return m;
}
//Getting GCC Country which has highest female users on social media platforms
float MaximumRow(int row)
{
float m = -Float.MAX_VALUE;
for (int i = 1; i < NumberOfColumns; i++)
{
if (!Float.isNaN(SocialData[row][i]))
{
if (SocialData[row][i] > m)
{
m = SocialData[row][i];
}
}
}
return m;
}
//Getting the minimum female users on social media platform in a table
float MinimumTable()
{
float m = Float.MAX_VALUE;
for (int i = 0; i < NumberOfRows; i++)
{
for (int j = 0; j < NumberOfColumns; j++)
{
if (isValid(i, j))
{
if (SocialData[i][j] < m)
{
m = SocialData[i][j];
}
}
}
}
return m;
}
//Getting the maximum female users on social media platform in a table
float MaximumTable()
{
float m = -Float.MAX_VALUE;
for (int i = 0; i < NumberOfRows; i++)
{
for (int j = 0; j < NumberOfColumns; j++)
{
if (isValid(i, j))
{
if (SocialData[i][j] > m)
{
m = SocialData[i][j];
}
}
}
}
return m;
}
}
public class SocialPlatform
{
//Initializing object of female users count on social media platforms by GCC countries
Dataset FemaleUsers;
//Attributes for maximum and minimum count
float dataMin, dataMax;
String datesMin, datesMax;
// for number of rows and number of columns
int rowCount, columnCount;
int columnNumber;
String GCCCountries[];
// Attributes for plotting graphs
float plotX1, plotY1, plotX2, plotY2;
//For coloring the graph
color hexcode;
float mx, my;
//function to draw social platform insight with color
SocialPlatform(color hexcode, int columnNumber)
{
//saving the color of social platform
this.hexcode = hexcode;
//for column number
this.columnNumber = columnNumber;
//For female Social Media users
FemaleUsers = new Dataset("SocialMediaUsersFemales.tsv");
//for row and column count
rowCount = FemaleUsers.getNumberOfRows();
columnCount = FemaleUsers.getNumberOfColumns();
//getting GCC country
GCCCountries = FemaleUsers.getNameOfRows();
//getting maximum and minimum value of female users on social media with respect to GCC Country
datesMin = GCCCountries[0];
datesMax = GCCCountries[GCCCountries.length-1];
dataMin = FemaleUsers.MinimumTable();
dataMax = FemaleUsers.MaximumTable();
//How much gap from the left of the screen
plotX1 = 50;
//Gap from the top of the screen
plotY1 = 150;
plotX2 = width - plotX1;
plotY2 = height - 50;
DrawFemaleUsersPoints(this.columnNumber);
DrawAreaofFemaleUsersbyMedia(this.columnNumber);
mouseMoved();
}
void DrawFemaleUsersPoints(int col)
{

  // for row count
  int rowCount = FemaleUsers.getNumberOfRows();

  for(int row = 0; row < rowCount; row++)
  {
    float value = FemaleUsers.getFloat(row, col);
    String mediaName = FemaleUsers.getColumnName(col);
    float x = map(row, 0, 12, 100, width - 50);
    float y = map(value, dataMin, dataMax, plotY2, plotY1);
    stroke(0);
    strokeWeight(3);
    point(x, y);
    mouseMoved();
    if((mx>100) && (mx<(width-50)))
     {
      stroke(2);
      strokeWeight(2);
      line(mx, plotY2, mx, plotY1);
      println("x: " + x + " y: " + y);
      if((abs(mx-x) < 5) && (abs(my-y) < 5))
      {
        fill(0);
        textSize(15);
        text(mediaName, mx+26, my-40);
        text(value+"%", mx+26, my-20);
      }
    }

    }
}
void DrawAreaofFemaleUsersbyMedia(int col)
{
fill(this.hexcode);
noStroke();
beginShape();
int rowCount = FemaleUsers.getNumberOfRows();
for (int row = 0; row < rowCount; row++)
{
float value = FemaleUsers.getFloat(row, col);
float x = map(row, 0, 12, 100, width - 50);
float y = map(value, dataMin, dataMax, plotY2, plotY1);
vertex(x, y);
}
// Draw the lower-right and lower-left corners.
vertex(plotX2, plotY2);
vertex(100, plotY2);
endShape(CLOSE);
}
void mouseMoved()
{
mx = mouseX;
my = mouseY;
}
}
 Dataset FemaleUsers;


  float dataMin, dataMax;
  String datesMin, datesMax;

  int rowCount, columnCount;
  int columnNumber;
  String GCCCountries[];

  float plotX1, plotY1, plotX2, plotY2;

  String hexcode;

  float mx, my;


SocialPlatform facebook;
SocialPlatform twitter;
SocialPlatform pinterest;
SocialPlatform instagram;
SocialPlatform youtube;
SocialPlatform reddit;
void setup()
{
size(1500, 300);
smooth();
FemaleUsers = new Dataset("SocialMediaUsersFemales.tsv");
rowCount = FemaleUsers.getNumberOfRows();
//For Social Media
FemaleUsers = new Dataset("SocialMediaUsersFemales.tsv");
rowCount = FemaleUsers.getNumberOfRows();
columnCount = FemaleUsers.getNumberOfColumns();
GCCCountries = FemaleUsers.getNameOfRows();
datesMin = GCCCountries[0];
datesMax = GCCCountries[GCCCountries.length-1];
dataMin = FemaleUsers.MinimumTable();
dataMax = FemaleUsers.MaximumTable();
//How much gap from the left of the screen
plotX1 = 50;
//Gap from the top of the screen
plotY1 = 150;
plotX2 = width - plotX1;
plotY2 = height - 50;
}
void draw()
{
  background(244);
  title();
  DrawGCCCountriesLabels();
  DrawFemaleUsersLabel();
  smooth();

  facebook = new SocialPlatform(#4267B2, 0);
  pinterest = new SocialPlatform(#BD081C, 1);
  twitter = new SocialPlatform(#1DA1F2, 2);
  instagram = new SocialPlatform(#FFDC80, 3);
  reddit = new SocialPlatform(#FF4500, 4);
  youtube = new SocialPlatform(#FF0000, 5);
}
void title()
{
fill(0);
textAlign(CENTER);
textSize(20);
text("Female Social Media Users by Percentage By GCC Countries", width/2, 30);
}
void DrawGCCCountriesLabels()
{
fill(0);
textSize(10);
textAlign(CENTER, TOP);
stroke(224);
strokeWeight(1);
int rowCount = FemaleUsers.getNumberOfRows();
for(int row = 0; row < rowCount; row++)
{
float x = map(row, 0, 12, 100, width-50);
text(GCCCountries[row], x, plotY2 + 10);
line(x, 50, x, plotY2);
}
}
void DrawFemaleUsersLabel()
{
fill(50);
textSize(10);
textAlign(RIGHT, CENTER);
for (float p = 0; p < 101; p += 25)
{
float y = map(p, 0, 100, plotY2, 50);
text(int(p), plotX1 + 40, y);
textSize(10);
textAlign(CENTER, CENTER);
text("Percentage\nof female \n social\nmedia users",45, height/2);
}
}
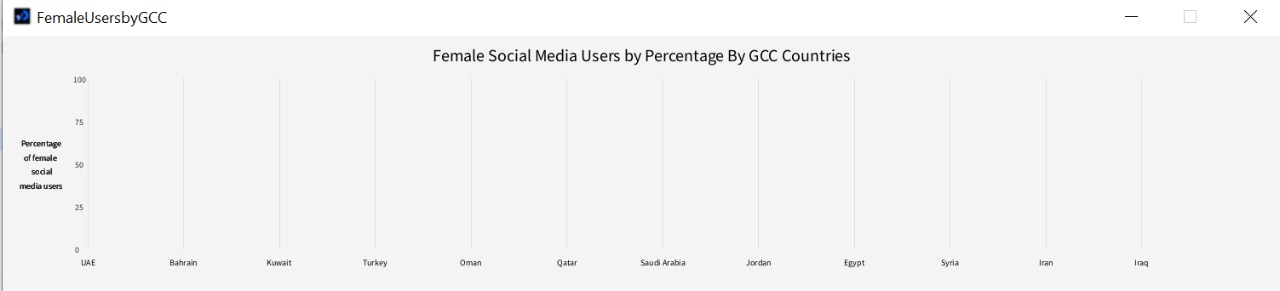
FINAL WORK:
CONCLUSION:
The assignment made me explore how to manipulate data and visualize it in a knowledgeable way with the use of object-oriented programming. I learned to plot graph areas and the basic of graphs and charts. Not only did I familiarize myself with how to collect data and prepare it for data visualization, but also on how to display and manipulate with text and strings in processing.
One thought on “Week 4 : Data Visualization”
Really great job on stacking up the different social media platforms and having the interactive element to show what is what. Love the topic too!

Really great job on stacking up the different social media platforms and having the interactive element to show what is what. Love the topic too!