
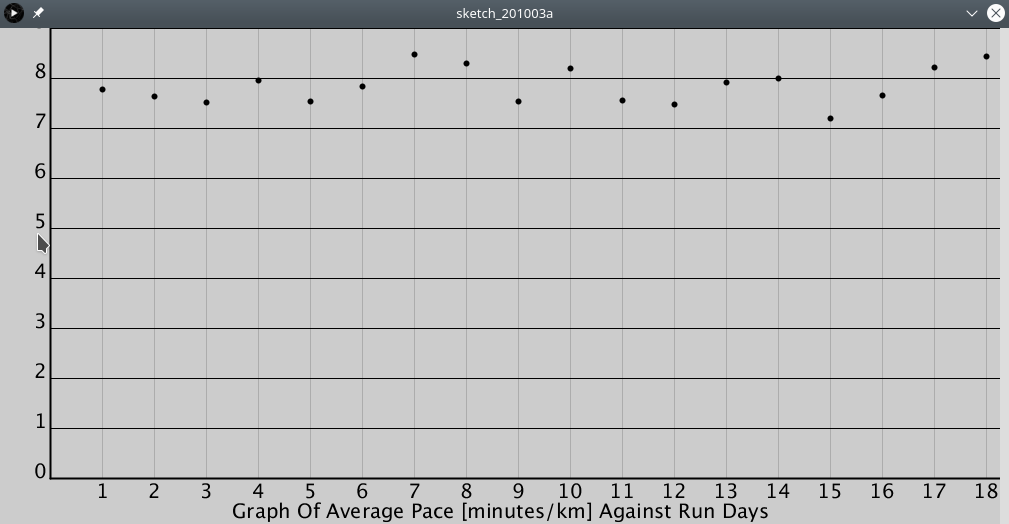
For this week’s assignment I decided to use that was being collected by the running app that I am using to track my running progress. The app records the distance per run, walking pace, running pace and the average pace.
For this assignment I took the average pace per run [given in minutes/km] and point plotted it against the days.
The data was between 0 and 9 so I have to get that data in the range such that I could plot it on the screen. For this I used the following formula
data*(maxDrawableHeight)/9.
This gave me the height of the points from the axis but since the drawing points are given from top left corner going down I inverted this by subtracting this from the drawable height.
Table data;
float[] numericData;
float [] plotData;
int numCols;
int axisOffset = 100;
void setup() {
  size(1000, 500);
  loadData();
  dataTransformation();
  drawAxes();
  drawGrid();
  printLabels();
  plotPoints();
  noLoop();
}

void draw() {
}

void drawAxes() {
  axisOffset = 50;
  pushStyle();
  strokeWeight(2);
  //y axis
  line(axisOffset, 0, axisOffset, height-axisOffset);
  //x-axis
  line(0+axisOffset, height-axisOffset, width, height-axisOffset);
  popStyle();
}

void loadData() {
  data = loadTable("data.csv");
  TableRow row = data.getRow(0);
  numCols = row.getColumnCount();
  numericData = new float[numCols];
  for (int i=0; i<numCols; i++) {
    numericData[i] = Float.parseFloat(row.getString(i));
  }
  //println();
}

void printData() {
  for (int i=0; i<numericData.length; i++)
  {
    print(numericData[i] + " | ");
  }
  println();
}

void drawGrid()
{
  // data will be in the range of 0 < 9*(height-axisOffset)
  pushStyle();
  stroke(0,0,0,40);
  // for drawing Horizontal grid lines
  float xLineGap = (height-axisOffset)/9;
  for (float y=height-axisOffset; y>=0; y=y-xLineGap){
    line(axisOffset,y,width,y);
  }
  //println(numCols);
  float yLineGap = (width-axisOffset)/numCols;
  for (float x=axisOffset+yLineGap;x<=width; x+=yLineGap)
  {
    line(x,0,x,height-axisOffset);
  }
  popStyle();
}

void dataTransformation(){
  // data will be in the range of 0 < 9*(height-axisOffset)
  //transform the data
  plotData = new float[numCols];
  for(int i=0;i<numCols;i++)
  {
    plotData[i] = numericData[i]*(height-axisOffset)/9;
  }
  //println(plotData);
}

void plotPoints(){
  float yLineGap = (width-axisOffset)/numCols;
  for(int i=0;i<numCols;i++){
    strokeWeight(6);
    float yCoord = height-(plotData[i]+axisOffset+yLineGap);
    //println(plotData[i]);
    point(axisOffset+yLineGap+(yLineGap)*i,yCoord);
  }
}

void printLabels(){
  //title
  fill(0,0,0);
  textSize(20);
  textAlign(CENTER);
  String title = "Graph Of Average Pace [minutes/km] Against Run Days";
  text(title,width/2, height-(axisOffset/5));


  //x-axis labels
  float yLineGap = (width-axisOffset)/numCols;
  for(int i=0;i<numCols;i++)
  {
    text(i+1,axisOffset+yLineGap+(yLineGap)*i, height-(axisOffset*3/5));
  }

  //y-axis labels
  float xLineGap = (height-axisOffset)/9;
  int text = 0;
  for(float y=height-axisOffset; y>=0; y=y-xLineGap)
  {
    text(text,axisOffset-10,y);
    text++;
    //println(text);
  }

  for (float y=height-axisOffset; y>=0; y=y-xLineGap){
    line(axisOffset,y,width,y);
  }
}
Technically you did well and this works great, however, it looks a little like a graph Excel would produce, or Matlab. Given the power of being able to creatively code a data vis, it would’ve been great to find a more creative way to communicate this data. Perhaps on days when you run faster you show pictures of yourself looking stronger and conversely on days you ran slower show tired pictures of yourself. there are si many possibilities! You got the technical part, but missed out on the creative part.