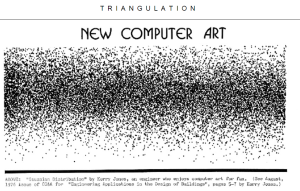
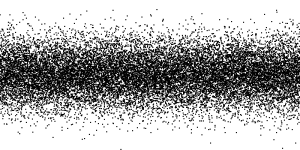
I am a psychology major and thus encounter Gaussian distributions quite a lot. That is why I decided to recreate Terry Jones’s piece entitled – you guessed it – “Gaussian distribution”.
Terry Jones: “Gaussian Distribution”
Miha Klasinc: “Terry Jones’s Gaussian Distribution”
Processing facilitated my job quite a lot since it provided me with a built-in Gaussian distribution function. The function outputs a number following standardized normal distribution. This means that there is a roughly 68% probability that the outputted number is within one standard deviation (i.e. 1 unit) away from the mean 0, a 95% probability that the number is within two standard deviations away from the mean etc. If the function is called a number of times (e.g. 10000 times), a relatively uniform distribution of values clustered around the mean emerges. I created a for loop that calls the Gaussian distribution function 20000 times. Upon each iteration, a small circle is created. The first circle’s X coordinate is set to 1 and then increases by 1 with each iteration. If the X value exceeds the limits of the canvas the X coordinate is set back to 0. The circles’ Y coordinates are determined by the addition of outputted random numbers to half of the canvas’ size. This results in circles being distributed around the line that splits the canvas into two equal halves.
Here’s the code:
int xCoordinate = 1;
int canvasHeight = 400;
float middleLine = canvasHeight/2;

void setup() {
  size(800, 400);
  background(255);
}

void draw(){
  stroke(0);
  fill(0);
}


void GaussianDistr(){
  for(int i = 0; i < 20000; i++){
    float y = randomGaussian() * 50;
    ellipse(xCoordinate,middleLine+y,2,2);
    xCoordinate++;
    if(xCoordinate >= width){
      xCoordinate = 0;
    }
    println(xCoordinate);
    redraw();
  }
}

void mousePressed() {
  GaussianDistr();
  redraw();
  saveFrame("GaussianDistribution.png");
}


