Assignment 4: Generative Text

Concept & Inspiration

Aaron Sherwood’s portfolio website had me impressed since the past 2 years, and it had been on my to-do list of things to learn just because of how addictive its animations were. Therefore, I decided to pursue this assignment in p5js to produce something similar and learn something new.

The website I took inspiration from is linked here

Embedded Canvas

The assignment outcome is attached as an embedded sketch as follows:

Code

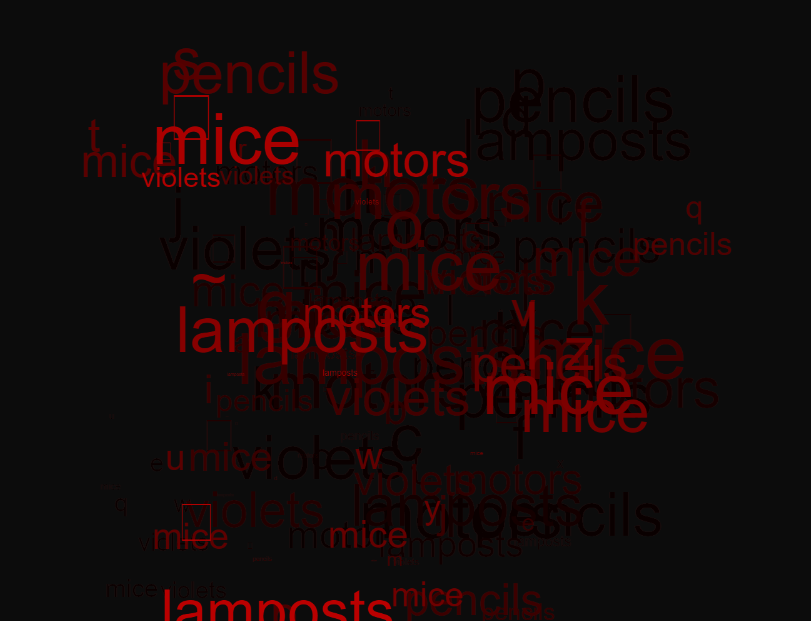
The methodology to convert the text to points:

function setup() {
  createCanvas(600, 400);
  textSize(64);
  textFont(font);

  for (let i = 0; i < texts.length; i++) {
    let points = font.textToPoints(texts[i], 50 + i * 150, height / 2,50, {sampleFactor: 0.75, simplifyThreshold: 0 });
    for (let j = 0; j < points.length; j++) {
      let p = new Particle(points[j].x, points[j].y);
      particles.push(p);
    }
  }
}

Object Oriented Nature of the Particles!

class Particle {
  constructor(x, y) {
    this.pos = createVector(x, y);
    this.vel = createVector(random(-1, 1), random(-1, 1));
    this.acc = createVector(0, 0);
    this.target = createVector(x, y);
    this.size = 2;
    this.maxSpeed = 2;
    this.maxForce = 0.1;
    this.attractRadius = 50;
    this.attractForce = 0.1;
    this.color = color(255, 255, 255);

  }

  behaviors() {
    let arrive = this.arrive(this.target);
    this.applyForce(arrive);
    this.repel();
  }

  repel() {
    let mouse = createVector(mouseX, mouseY);
    let distance = p5.Vector.dist(this.pos, mouse);
    if (distance < this.attractRadius) {
      let repelForce = p5.Vector.sub(this.pos, mouse).normalize().mult(this.attractForce);
      this.applyForce(repelForce);
    }
  }
    attract() {
    let mouse = createVector(mouseX, mouseY);
    let distance = p5.Vector.dist(this.pos, mouse);
    if (distance < this.attractRadius) {
      let attractForce = p5.Vector.sub(mouse, this.pos).normalize().mult(this.attractForce);
      this.applyForce(attractForce);
    }
  }

  applyForce(f) {
    this.acc.add(f);
  }

  arrive(target) {
    let desired = p5.Vector.sub(target, this.pos);
    let d = desired.mag();
    let speed = this.maxSpeed;
    if (d < 100) {
      speed = map(d, 0, 100, 0, this.maxSpeed);
    }
    desired.setMag(speed);
    let steer = p5.Vector.sub(desired, this.vel);
    steer.limit(this.maxForce);
    return steer;
  }

  update() {
    this.pos.add(this.vel);
    this.vel.add(this.acc);
    this.acc.mult(0);
  }

  show() {
    // Set the fill color based on the velocity of the particle
    let vel = this.vel.mag();
    if (vel < 0.5) {
      this.color = color(255, 0, 0); // red
    } else if (vel < 1) {
      this.color = color(255, 255, 0); // yellow
    } else {
      this.color = color(255, 255, 255); // white
    }

    fill(this.color);
    noStroke();
    ellipse(this.pos.x, this.pos.y, this.size, this.size);
  }
}


Problems

The primary issue I faced was to discover the font.textToPoints() function and its complex usage. The other difficult bits was to repel or attract the points and adjust the speed and colors of it!

Assignment 4 – Generative Text

Concept

For this project, I decided to go for the Generative Text option, because I felt that way I could get some experience both with manipulating text and implementing csv files as well. I really wanted to use particle systems to generate text and do some fun stuff with them so I went ahead and explored a little on how to implement a particle system in p5.js and use it to generate text.

Implementation

I started off by making a Particle class. This class essentially contains all the attributes that are related to the particles that are generated. For instance, it contains their velocity, acceleration, maximum speed, and whether they have left the canvas yet or not, or in other words, if they are alive. I thought it would be a great idea to use vectors for this scenario since velocity and acceleration basically are defined by a magnitude and direction (which in essence is a vector). So I went ahead and made unit vectors for both of them.

// creating the class for the particles
class Particle {
  // the x and y positions where the particle would appear
  constructor(x, y) {
    this.pos = createVector(x, y);
    this.vel = createVector(random(-1, 1), random(-1, 1)); // to include all directions (360 deg)
    this.acc = createVector(random(-1, 1), random(-1, 1)); // to include all directions (360 deg)
    this.maxSpeed = 20; // limiting max speed of the particle
    this.prevPos = this.pos.copy(); // will use this as a starting point to create a line 
    this.alive = true; // to check if the particle has left the canvas
  }

As for the methods, the update method would add acceleration to the velocity vector and increase the acceleration at the same time as well. The particles are displayed as lines by using the current and previous positions of the particles in every frame. This really makes the particles look as though they are flying off like shooting stars when the ENTER key is pressed.

// to make the particle move
update() {
  this.vel.add(this.acc); // to make the particles move with increasing speed
  this.vel.limit(this.maxSpeed); // limiting them to a max speed
  this.pos.add(this.vel); // making them move by changing their position
  this.acc.mult(2); // increasing acc on every update so the lines become longer
}

// making lines to make particles appear
show() {
  stroke(random(255), random(255), random(255));
  // using previous pos and updated pos to make a line for the travelling particle
  line(this.pos.x, this.pos.y, this.prevPos.x, this.prevPos.y);
  // updating the prev position
  this.prevPos = this.pos.copy();
}

Another interesting method I used was the one that allowed the pixels to wrap around the text. I did this by looping over all the pixels in the canvas and checking if the pixel was white or 255. If it was then I would place a particle at that pixel. I didn’t display the text itself, it only appeared for a split second in one of the frames of the draw() function and during that time the particles would stick to that text. The nested for loops I used were as follows:

// the nested for loop traverses over the whole canvas and finds where the 
// white pixels of the text are located
for (let x = 0; x < width; x += 2) { // number after += indicates density of particles
  for (let y = 0; y < height; y += 2) { // lesser number = more performance problems
    let index = (x + y * width) * 4;
    if (pixels[index] == 255) { // checking if the text is present at the current pixel
      let p = new Particle(x, y); // if yes then make a particle at that position
      particles.push(p); // and add it to the array
    }
  }
}

Reflection

I really enjoyed working with text and particles during this assignment and I feel I learned a lot about particle movement, vectors, and pixels; all of which were new concepts for me. I did notice a strange bug however while I was working on this assignment and I wasn’t quite able to fix it. I was initially working on my monitor for this assignment and it was working just fine, but as soon as I opened the p5.js file on my laptop screen, the particles that made up the word were not aligned at their correct positions on the screen. I really tried to dig deep into this issue but I couldn’t understand why it was happening. Due to this, I had to fix the position of the random particle text on the center of the screen instead of using the mousePos  to generate it. I would love to explore more on how I could resolve this bug as I have never encountered a bug like this before in p5.

Week 4 – Data Visualization

Concept

Having taken MVC last semester, as with many others, spherical coordinates are still stuck in my head. Since my last week’s assignment was space themed, I wished to stick with it for a bit longer. With the inspiration from this p5js sketch and the help of this video, I was able to understand how to plot points using the three axes in p5js. As there are few things to be plotted on the globe compared to the standard map, I decided to concern this project with meteorite landings.

I downloaded my CSV file from the NASA website and cleaned it up in Microsoft Excel such that it contained only the relevant rows, mass, latitude, and longitude. Furthermore, I removed the rows with blank cells so that they do not take up more space than needed.

function preload() {
  meteors = loadTable("M_New.csv", "csv");
}

After plotting the points I was left with the following sketch:

https://editor.p5js.org/ajlasacic/full/yxr9xvKC4

Note: The program is very demanding so I posted only the link in order not to crash the website. By changing the step variable, more landings can be seen.

Challenges

The most challenging part was understanding where the latitude and longitude are supposed to be pasted. Since they were given in degrees in the CSV file, I put the angleMode() to DEGREES. Unfortunately, this plotted the points only on one side of the globe, which took some time to understand why. After reverting back to normal parameters, the points were plotted just right.

let mass = meteors.getColumn(0);
  let lat = meteors.getColumn(1);
  let lng = meteors.getColumn(2);

  for (let i = 2; i < n; i += step) {
    let lat_ = lat[i];
    let lng_ = lng[i];

    strokeWeight(map(mass[i], 0, upper_mass_size, 0.7, 5));
    if (flag == true) {
      stroke(map(mass[i], 0, upper_mass_color, 120, 30), 100, 90);
    } else {
      stroke(255);
    }

    let z = r * cos(lat_);
    let y = r * sin(lat_) * sin(lng_);
    let x = r * sin(lat_) * cos(lng_);
    point(x, y, z);
  }

Another challenge was understanding how to map the size of the magnitude of the meteors on the map. By using the MIN and MAX functions in Excel, I extracted the smallest and biggest values within the dataset and set them as the values of their respective variables. By using the map() function (considerably the best function in p5js), I was able to set different sizes to the points within the sketch. By trial and error method, I was able to conclude 0.7 and 5 were perfect

strokeWeight(map(mass[i], 0, upper_mass_size, 0.7, 5));

Although the meteors in the dataset are quite similar in mass, slight differences can be seen on the graph. Lastly, I wished to create the sphere more interactive by changing colors. The colors were also added using the map() function, but I was stuck on how to change them when the mouse was pressed. By adding a global boolean flag variable, I was able to overcome this issue and change the color by setting its value to true or false.

Reflection

Although I am not quite satisfied with this project, I am grateful that I could achieve its main purpose which was plotting in 3d. I tried adding texture to the sphere to show the countries, but the picture did properly wrap no matter how much I edited it. In the future, I wish to make the plot more readable by adding either country outlines or an earth texture. Overall, I am pleased that I know how to plot in 3d using p5js.


Generative Text_Aaron

Concept

The idea for this code was to generate a random text/ character on the canvas using noise feature. the canvas color becomes darker and darker with each word generated and printed on the screen. I was inspired by the idea of dots disappearing from my computer screen as I worked on a data visualization project I had given up on.

Implementation

The concept was implemented using p5.js. Key technical implementations includes preload and noise feature.

Challenges

Some of the challenges I faced was randomizing the position of both the word and character on the screen; I couldn’t solve it.

Generative Text – Aigerim

Inspiration/Concept

For this project, I created a fortune cookie application that gives a random fortune. I love getting fortune cookies and seeing my luck (even though I do not believe in them, it is still a fun activity), and I wanted to transfer that fun little moment into a web application. To create the effect of anticipation one gets when opening the cookie’s package I made a fortune come up as in a typewriter, letter by letter without revealing everything all at once.

The Product

I am really happy with the way it turned out, especially given that I was not really sure what I was going for when I just started the project. The product is really simple and minimalistic, and I love it this way because I want the focus to be on the fortune itself, which I think was achieved pretty nicely.

Challenges

The biggest challenge for me was restarting the typewriter when a user clicks on the mouse and the typewriter is done writing. Since my function is not blocking, I had multiple fortunes written on top of one another at some point. To solve this, I added a boolean printing that is set to True whenever I am about to enter the typeWriter function within start and set it back to False when I am about to leave it. Then, whenever a mouse is clicked, I first check whether the variable is true or not and print a new fortune when the previous one is done printing (or displaying) and the user clicks.

function start() {
  if (printing == false) {
    printing = true;
    typeWriter(random(fortunes), 0, 50, height / 2, 80);
  }
}

function mouseClicked() {
  start();
}


HW4: Generative Text Video

Inspiration

The inspiration for this generative text art was to use text to render a live video. The goal was to use the brightness of each pixel in a video capture to determine the color of a letter displayed in the center of the pixel and to keep rendering this video live. The code was inspired from a coding challenge by coding train.

Concept

The concept was to create a generative piece of art that was unique to the video input. The text displayed would change based on the brightness of each pixel, resulting in a dynamic and ever-changing piece of art. The text used was limited to the string “ME” and the letters were displayed in the center of each pixel. The string can also be changed to say something else.

Implementation

The implementation involved using the p5.js library to capture video input and display text on a canvas. The code loops through each pixel in the video capture, calculates the brightness of the pixel in grayscale, and uses that value to set the color of the displayed text. The text is displayed in the center of each pixel and changes based on the brightness of the pixel.

Challenges

One of the main challenges that I faced was to decide on an appropriate dimensions of the rendered video in order for p5.js to not break while looping through the video.

Reflections

Overall, this project was a successful exercise in creating generative art using code. The dynamic and ever-changing nature of the art is an interesting concept that can be expanded upon in future projects. The ability to use video input as the source for the art adds an extra level of interactivity and uniqueness to the piece.

Sketch Link: https://editor.p5js.org/swostikpati/full/U-0U4yVHN

References

Week 4 – Love Yourself :)

Overview:

For this assignment, I tried to utilize the typography concepts learned in class in combination with WebGL (Web Graphics Library), to create an interactive generative text.

Concept:

I’m really into typography and generative text art, so I particularly enjoyed working on this assignment. I was surfing though Pinterest for inspiration, and was inspired by the works below. Unable to choose between those two works, I decided to combine them.

The concept of this work is self-love and simplicity. I like setting these kind of photos as my phone wallpaper as a reminder to not compare my journey with other’s journey, because it’s hard to forget it or ignore it when it’s right in front of my nose 🙂 Therefore,  I decided to create my own wallpaper using the code.

Since the concept is “self-love”, I relied on the colors associated with love, such as red, white and black (as they’re basic colors). I also played around with the opacity of the text, and created a fade-away effect for the text as it progresses down the row.

Code:

The major highlights of my code are the sine-wave text and heart made of the word “love”. First, I created a sine-wave by using by displaying the string character by character and using sin() function to make y-value dependent on the x-value of the text.

To draw the heart, I used the mathematical formula based on the polar coordinates which is described in this video. However, I adapted the formula used there to my code so that instead of the vertices, my shape will consist of  the words “love”. I used beginShape() and endShape() to connect the words together to form a heart shape, and I used push() and pop() to limit the rotation only to the heart. To make the rotation effect, I utilized the rotateY() function of the WEBGL library, which allows us to rotate the shape around the y-axis.

I also tried to integrate some interactivity to this work: the user would be able to change the “mode” of the artwork from bright to dark by pressing the mouse (when the mode changes, the main text also changes). Also, the user can control the rotation by stopping or continuing it through the key “s”.

Here are the parts of the code I referenced:

//draw the heart
  let letter= "love";
  textSize(sizeHeart);
  
  //create a shape to be able to rotate it later
  beginShape();
  //use push and pop to apply the rotation only to the heart shape
  push();
  
  if(toStop==false){
    //rotate the heart around the y-axis
      rotateY(millis() / 1000);
  }

  
  //opacity of the heart is modifiable
  fill(210, 4, 45,heartOpacity);
   stroke(0);
  
  //if we set a to be 0.01, we will get a heart with densely located letters 
  for(let a=0; a<TWO_PI; a+=0.05){
    let r=10;
    let x= r*16*pow(sin(a),3);
    let y=-r*(13*cos(a) - 5*cos(2*a) - 2*cos(3*a) - cos(4*a))
    text(letter,x,y);
  }
  pop();
  endShape();
//draw the text
  let textLength = msg1.length;
  let tWidth = textWidth(msg1);
  noStroke();
  textSize(sizeMsg);
  
  //plce the text in the center
  let textStart_x = 0 - (tWidth / 2) + 20;
  
   //make the characters of the string follow a sine wave pattern
  for(j=0; j<5; j++){
    
    //since we have 5 rows of the same text, each of the rows will start at different y locations
    let textStart_y = -20 + j*20;
    
    for(i=0; i<textLength; i++){
      
      //change the text and its opacity when the mouse is pressed
      if(mouseIsPressed){
        fill(255,255,255,80*(j+1));
        msg1="trust yourself trust yourself trust yourself trust yourself trust yourself";
      }
      else{
        fill(0,0,0, 30*(j+1));
        msg1="love yourself love yourself love yourself love yourself love";
      }
      
      //print the text by printing characters one by one
      text(msg1[i],textStart_x+i*10, textStart_y+10*sin((textStart_x+i*10)/30));
    }
  }

Reflection and future Improvements:

Overall, I really enjoyed working on this assignment (I enjoyed it as much as making my self-portrait, haha) and I’m content with how my work turned out as well. One of the suggestions for further improvement would be using more heart shapes of different size and making them rotate in different pace and direction to emulate the heart-shaped medallion. Also, playing around with the color of the text and applying different colors to different rows or characters is also one suggestion.

Assignment 4- Generative text

INSPIRATION

In this assignment, out of the two prompts which we could provide a submission for, I decided to go with the “generative text” one. As usual, coming up with what to do was a challenge for me. I spent a lot of time going through YouTube videos and existing samples to draw inspiration from them but could not get any.  While perusing YouTube, I saw a video about Apple’s next big event. That was when it dawned on me that every time I got a new Apple device, the first welcome screen would write the word “hello” in many different languages. See below:

After watching the above video, I decided to recreate something similar to it.

PROCESS 

The code starts by initializing my variables and the array to hold the “hello” translations to be displayed. A word class is created. The Word object is initialized with the first word in the words array. Then, each time the display() method is called, the current word is displayed, and index is incremented. When the index reaches the end of the array, it is reset to 0 so that the words cycle through from the beginning again. Finally, in the draw() function, a new Word object is created every 100 frames using the update index value. To make the words look just like that of Apple’s I had to download and import the “California” font using the preload() and loadFont() functions.  I initially had the translations in so many languages including Japanese, Chinese and some other languages but the font-type I decided to use did not have support for writing in these languages so i had to take them out of my array.

WORK:


FUTURE IMPROVEMENT

In a future version, i intend to add more style to the written texts. I intend to make the display appear as though it is being written by hand just as it is in the original piece by Apple.


Assignment 4: Data Visualization

Concept:

Upon looking at a bunch of open source data sets, I found a data set for Exoplanets that have been documented outside our solar system by NASA: https://www.kaggle.com/datasets/adityamishraml/nasaexoplanets

I thought this would be pretty cool to implement as a form of data visualization as I don’t think I’ve seen any examples of data visualization for astronomy or space hence, I decided to implement this into my assignment.

Process and Planning:

For visualizing the exoplanets, I didn’t want to simply draw an ellipse as I thought it wouldn’t look that great and it would be too simple. Hence, I found some nice planet art online and used some of them to visualize some of the exoplanets:

I used a few of these planets and put them into some img variables and then put them all into an array of planet designs so that I could access any design I wanted from this array anytime I wanted. I also loaded the entire exoplanets.csv dataset into an array called exoplanet_data which I would plan to use later in my code.

function preload() {
  exoplanet_data = loadStrings("exoplanets.csv");

  planet1_img = loadImage("Planet1.png");
  append(planet_designs, planet1_img);
  
  planet2_img = loadImage("Planet2.png");
  append(planet_designs, planet2_img);
  
  planet3_img = loadImage("Planet3.png");
  append(planet_designs, planet3_img);
  
  planet4_img = loadImage("Planet4.png");   
  append(planet_designs, planet4_img);
  
  planet5_img = loadImage("Planet5.png");
  append(planet_designs, planet5_img);
}

I knew that I would have to create a class in which each exoplanet would be its own object, hence I made one here:

class ExoPlanet {
  constructor() {
    this.x;                  //X coordinate for the planet                    
    this.y;                  //Y coordinate for the planet 
    this.planet_radius;      //Radius of the planet image
    this.design_num;         //Type of planet design from planet_designs
    this.data;               //String data of the planet
    this.data_split;         //Splits the data into an array of its data
    
    this.init();
    this.printData();
  }
  
  //This function initializes all the variables for each exoplanet.
  init() {
    this.design_num = int(random(5));
    this.planet_radius = planet_designs[this.design_num].width/10;
    
    this.x = mouseX;
    this.y = mouseY;
    
    this.data = exoplanet_data[data_count];
    this.data_split = split(this.data, ',');
    if(data_count != exoplanet_data.length) {
      data_count++;
    }
    else {
      print("All planets printed!");
    }
  }
  
  //This function takes a random planet image and draws it at a random (x,y) coordinate on the canvas
  draw() {
    image(planet_designs[this.design_num], this.x, this.y, planet_designs[this.design_num].width/5, planet_designs[this.design_num].height/5);   
  }
  
  displayData() {
    fill(255, 255, 180);
    rect(mouseX, mouseY, 500, 120);
    
    textAlign(LEFT);
    fill("black");
    
    text("Planet Name:", mouseX+10, mouseY+30);
    text("Distance from Earth (ly):", mouseX+10, mouseY+55);
    text("Stellar Magnitude (brightness):", mouseX+10, mouseY+80);
    text("Planet Type:", mouseX+10, mouseY+105);
    
    fill("red");
    text(this.data_split[0], mouseX+140, mouseY+30);
    text(this.data_split[1], mouseX+235, mouseY+55);
    text(this.data_split[2], mouseX+290, mouseY+80);
    text(this.data_split[3], mouseX+125, mouseY+105);
  }
  
  //This function is for debugging and code checking to ensure everything runs smoothly.
  printData() {    
    print("Planet Image:",this.design_num);
    print("Planet Radius:",this.planet_radius);
    print("Planet Data:",this.data);
    
    print("Planet Name:",this.data_split[0]);
    print("Distance (from Earth):",this.data_split[1]);
    print("Stellar Magnitude:",this.data_split[2]);
    print("Planet Type:",this.data_split[4]);
  }
}

In this class, each planet has:

  • An (X, Y) coordinate of the planet on the canvas (this would be where the user’s mouse is when they click)
  • The radius of the planet (so when the user moves close to the planet, its data pops up)
  • Design number: This indicates any one of the planet images shown perviously.
  • Data: This entails the particular planet data from the csv file for that planet.
  • Data_Split: This variable would be an array of each component of the data of the planet, hence, it would be easier to print out its data.

I had an initialize function, init(), to initialize it with some variables. I had another function which would draw the planet onto the canvas using the image(). Finally, I had a displayData() function which would print out a rectangle containing some of the vital information of the exoplanet’s data.

How does the data pop up?

//Here we continuously draw the planets on the canvas
for(let j=0; j<exoplanets.length; j++) {
  exoplanets[j].draw();
  planet_dist = dist(exoplanets[j].x, exoplanets[j].y, mouseX, mouseY);
  
  //If the mouse coordinates hit's the planet, it will print the data of that planet.
  if(planet_dist < exoplanets[j].planet_radius) {
    exoplanets[j].displayData();
  }
}

Essentially, in the draw() function, it will continuously print the exoplanet using the draw function from the class. It calculates the planet_dist between the planets coordinates and the user’s mouse. If the user’s mouse touches the planet, then it will call the displayData() function.

I added it such that the user can add a planet onto the canvas by simply clicking their mouse as well.

Final Piece:

Overall Thoughts:

Overall, I’m pretty happy with the interactivity and design with my assignment. Perhaps, for improvements I could have included more planet shapes, and maybe even added some cool sound effects to enhance the experience a little more. More improvements, I could have also made sure that if the planet size was bigger, the planet drawn could also be bigger and vice versa. This way the data visualization is even stronger.

Midterm Project Ideas:

For my midterm, I wanted to develop a game since I really love games and would love to get into game development. Some of the ideas that initially sparked in my head was perhaps something like “Battleship” or maybe something like a parody of “Subway Surfers” where the user can continuously run and get the highest score or something like that. For now these are the ideas I thought of initially but I’d love to come up with a cool unique game of my own.

Week 4 – Neon Sign

Inspiration:

I had a particularly challenging time with this assignment because I struggled to determine what to make for this topic. Despite scouring the internet for inspiration, I found examples that were either beyond my coding abilities or too basic. I tried multiple projects but was not satisfied because they weren’t creative enough. However, my fortunes changed when I received a Snapchat memory today, reminding me of a quote a friend wrote on my dorm’s whiteboard exactly one year ago. This quote has always been a source of inspiration for me to stay focused on my work and avoid procrastination, and it remains one of my favorite quotes. The Snapchat memory was:

I needed to come up with a unique way to showcase this text, which is when my roommate’s suggestion came in handy. While discussing ways to decorate our room, my roommate proposed the idea of using neon lights. The moment he mentioned this, I realized that adding a neon light effect to the quote could work.

Coding Process:

To begin with, I searched online for neon signs that can be used as room décor and was drawn to those with a cursive font. Hence, I opted for a cursive font and explored multiple websites until I found the “Havelberg” font. Following this, I researched how to add and implement this font using p5js. Once I gained this knowledge, I created a preliminary layout of the project, outlining where everything should be placed. The final skeleton looked somewhat like this:

Initially, I encountered challenges in making the project appear more visually appealing and imaginative. To tackle this, I got the idea of incorporating electricity that would flow through the wires and illuminate the sign upon pressing the “on” button. However, as I progressed, I realized that the end result was not as aesthetically pleasing as I had hoped. As a solution, I decided to remove the grey background and start with a blank canvas of darkness. The code for the electricity flowing looked like this:

if (on_button == true) {
    if (!sound.isPlaying()) {
      sound.play(); //the electric static voice
    }
    fill("gold"); //for the wires
    noStroke();
    //since upspeed is in negative values that is why we subtract
    if (height + upspeed > uplimit) {
      upspeed = upspeed + vertical_speed;
      rect(360, 400, wire_width, upspeed); //the first part of the wire and looks like electricity is travelling up
    } else {
      rect(360, 400, wire_width, upspeed); //when it has reached its limit, then it stops and stays there
      if (width + leftspeed > leftlimit) {
        //as soon as the wire part 1 has reached its designated limit, now we start moving to the left
        leftspeed = leftspeed + horizontal_speed; //horizontal speed is the same as upspeed so that it looks uniform
        rect(360, uplimit, leftspeed, wire_width); //leftspeed keeps updating so it looks like it is moving to the left
      } else {
        rect(360, uplimit, leftspeed, wire_width); //same as above
        if (height + upspeed2 > uplimit2) {
          upspeed2 = upspeed2 + vertical_speed; //upspeed2 is different from upspeed since the starting and ending points are different
          rect(360 + leftspeed, uplimit, wire_width, upspeed2);
        } else {
          rect(360 + leftspeed, uplimit, wire_width, upspeed2);
          stroke(57, 255, 20);
          strokeWeight(4);
          noFill(); //make rectangle after the last wire reaches the rectangle
          rect(25, 25, 350, 175, 20); //rectangle but with curved edges
          strokeWeight(1);
          fill(57, 255, 20, sin(frameCount * 0.1) * 255); //fills the text and adds a flicker effect to it
          text("you didnt come this far", 45, 95);
          text("just to come this far", 70, 145);
        }
      }
    }
  }

After adding the button, audio, and the mouseClicked() feature, the final product looked like this:

Reflection:

Despite feeling proud of the code I developed to create the electricity flow, I did not derive much personal satisfaction from this assignment. I felt that my creative potential was hindered and that the piece could have been more visually appealing if I had managed to let my creativity flow more freely. Unfortunately, I was experiencing a creative block that prevented me from fully enjoying the project. However, I plan to revisit this piece at a later date and explore ways to enhance its aesthetics. Apart from the creative aspect of it, I would want to add multiple neon signs in the future that take on random quotes from a csv file.