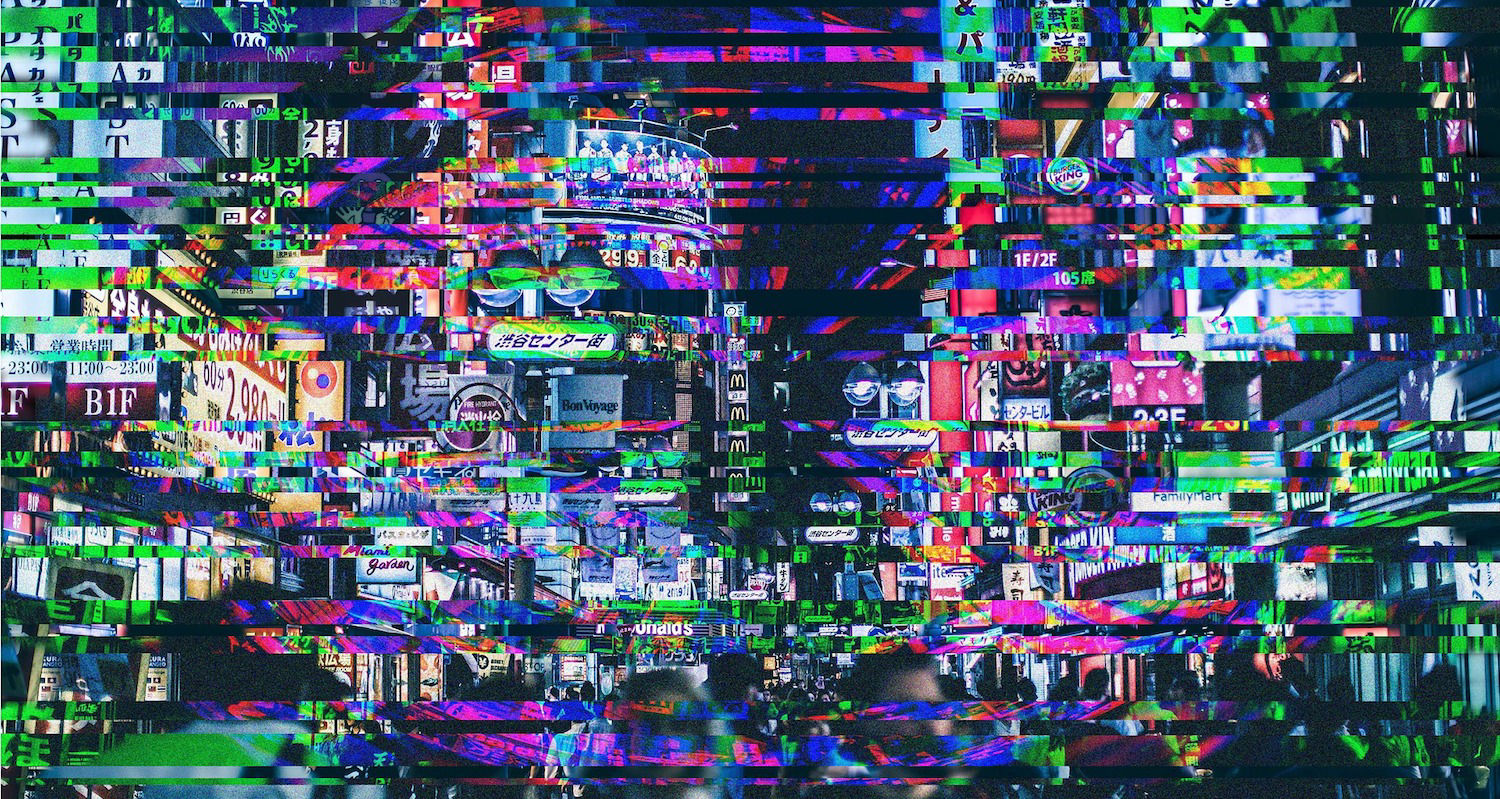
For this week’s assignment, I tried to remake the Digital Rain from the Matrix movie which consists of downward-flowing green characters representing the activity of the virtual environment of the Matrix on screen.
Process:
I have used two main classes: the first one represents a single character whereas the second class represents a combination of characters (vertical series of characters).
Let’s start with the first one. The “Letter” class includes a single function in addition to the constructor. The constructor takes two arguments representing both the x and y coordinates and randomly generates a character (Japanese character) using the ASCII table codes. Round() is used to find the closest integer, whereas the create() function prints the character on the display window.
// Letter class
class Letter{
  // Attributes
  char character;
  int xcoord, ycoord;

  // Constructor
  Letter(int xcoord, int ycoord){
    // x-coordinate
    this.xcoord=xcoord;
    // y-coordinate
    this.ycoord=ycoord;
    // Randomly generates a Japanese character (letter)
    character= char(round(random(12448, 12543)));
  }

  void create(){
    // Prints the character on the display window
    text(character, xcoord, ycoord);
  }
}
The second class representing the combination of characters includes two functions in addition to the constructor. One of its attributes is an array of “Letter” objects, which gets initialized in the constructor. I used a for loop to add the characters to the array, with the coordinates depending on the font size. The steps variable is used for the combination’s movement on the screen and is randomly chosen (between 5 and 10). The generate() function is mainly a for() loop that goes through the combination (array) and prints every character keeping in mind that the first character’s (the one at the bottom) color is lighter than the other ones. The gradient was achieved using transparency (alpha). The move() function moves the combinations to the bottom of the screen and checks when it disappears so that it can be taken to the top again.
// Combination class
class Combination {
  // Attributes
  ArrayList<Letter> combinations;
  int steps, startingpoint;

  // Constructor
  Combination(int xcoord, int ycoord){
    combinations = new ArrayList<Letter>();
    startingpoint = ycoord;

    // Create the Letters and add them to the array
    for(int ycoord2=startingpoint; ycoord2<FontSize*round(random(10,25))+startingpoint; ycoord2+=FontSize){
      combinations.add(new Letter(xcoord, ycoord2));
    }
    // Steps or Speed of the combination
    steps = round(random(5,10));
  }

  void generate(){
    for(int i=0; i<combinations.size(); i++){
        // Change the color of the text to green
        fill(text_color, i*15);
        // Make the first char's color lighter
        if (i==combinations.size()-1){
          fill (firstchar_color);
        }
        // Print the letters
        combinations.get(i).create();
        // Move the combination
        move(i);
    }
  }

  void move(int i){
    // Check when the combination leaves the screen
    if (combinations.get(0).ycoord>height){
      for(int j=0; j<combinations.size(); j++){
        // Get the combination to the top
        combinations.get(j).ycoord=-FontSize*(combinations.size()-(1+j));
      }
    }
    // Move the combination
    combinations.get(i).ycoord += steps;
  }
}
In the Setup() function, I set the size to 854 x 480, and the textAlign to the center top, and I changed the font to “Courier New”. Then using a for loop, I added all the generated combinations to the main array.
void setup(){
 size(854, 480);
 background(background_color);
 textAlign(CENTER, TOP);
 F= createFont("Courier New", FontSize);
 textFont(F);

 // Add all the combinations to the array
 Combinations = new ArrayList<Combination>();
   for(int i=10; i<width-10; i+=FontSize){
     // Set the Y coordinate randomly
     Combinations.add(new Combination(i,round(random(0,height-200))));
   }
 }
The draw() function resets the background and prints the characters.
void draw(){
  // Reset the background
  background(background_color);
  // Print all the characters
  for (int i=0; i<Combinations.size(); i++){
    Combinations.get(i).generate();
  }
}
PFont F;
int FontSize = 20;
color background_color = #161d20;
color text_color = #20c950;
color firstchar_color = #82e2a3;
ArrayList<Combination> Combinations;

// Letter class
class Letter{
  // Attributes
  char character;
  int xcoord, ycoord;

  // Constructor
  Letter(int xcoord, int ycoord){
    // x-coordinate
    this.xcoord=xcoord;
    // y-coordinate
    this.ycoord=ycoord;
    // Randomly generates a Japanese character (letter)
    character= char(round(random(12448, 12543)));
  }

  void create(){
    // Prints the character on the display window
    text(character, xcoord, ycoord);
  }
}

// Combination class
class Combination {
  // Attributes
  ArrayList<Letter> combinations;
  int steps, startingpoint;

  // Constructor
  Combination(int xcoord, int ycoord){
    combinations = new ArrayList<Letter>();
    startingpoint = ycoord;

    // Create the Letters and add them to the array
    for(int ycoord2=startingpoint; ycoord2<FontSize*round(random(10,25))+startingpoint; ycoord2+=FontSize){
      combinations.add(new Letter(xcoord, ycoord2));
    }
    // Steps or Speed of the combination
    steps = round(random(5,10));
  }

  void generate(){
    for(int i=0; i<combinations.size(); i++){
        // Change the color of the text to green
        fill(text_color, i*15);
        // Make the first char's color lighter
        if (i==combinations.size()-1){
          fill (firstchar_color);
        }
        // Print the letters
        combinations.get(i).create();
        // Move the combination
        move(i);
    }
  }

  void move(int i){
    // Check when the combination leaves the screen
    if (combinations.get(0).ycoord>height){
      for(int j=0; j<combinations.size(); j++){
        // Get the combination to the top
        combinations.get(j).ycoord=-FontSize*(combinations.size()-(1+j));
      }
    }
    // Move the combination
    combinations.get(i).ycoord += steps;
  }
}

void setup(){
 size(854, 480);
 background(background_color);
 textAlign(CENTER, TOP);
 F= createFont("Courier New", FontSize);
 textFont(F);

 // Add all the combinations to the array
 Combinations = new ArrayList<Combination>();
   for(int i=10; i<width-10; i+=FontSize){
     // Set the Y coordinate randomly
     Combinations.add(new Combination(i,round(random(0,height-200))));
   }
 }

void draw(){
  // Reset the background
  background(background_color);
  // Print all the characters
  for (int i=0; i<Combinations.size(); i++){
    Combinations.get(i).generate();
  }
}
In this assignment I am going to draw visualization graphs. Gives me opportunity to learn how to draw graphical representation of information and data. Human eye is trained on colors and patterns, and visualizing big scale data in terms of graphs and charts helps in understanding the data niches.
The idea for computer graphic:
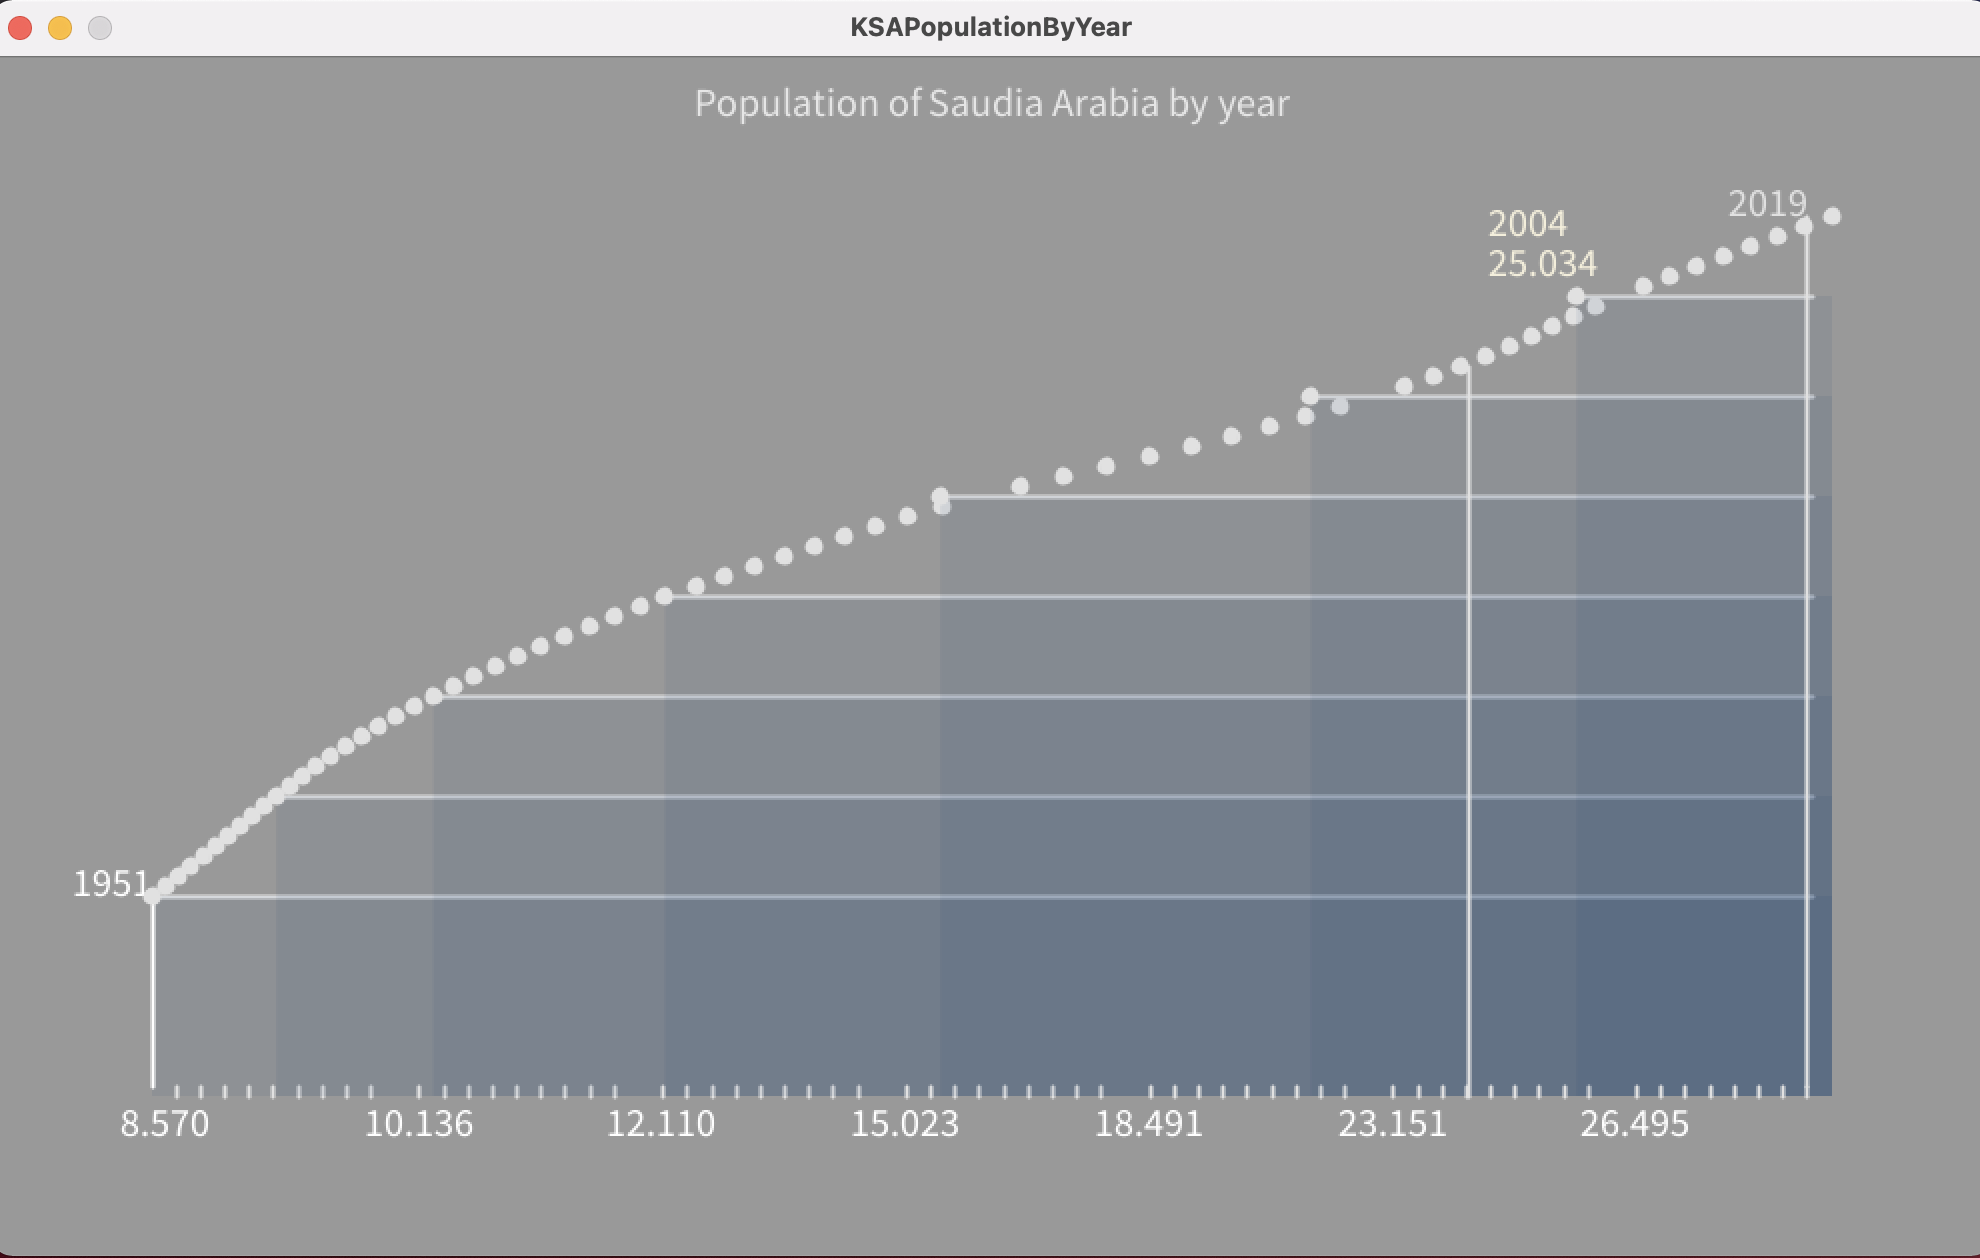
Every country economics depends upon the population and population of every country is increasing day by day. I got my idea of data visualization from the population of kingdom of Saudi Arabia. I collected data of KSA population from 1951 to 2019.
Challenges and Problems:
It was challenging for me to decide for the right graph to visualize population data. Plotting the points on x and y coordinates was also challenging because population is increasing for every next year. Reading of each year population value and storing in a 2D array was little challenging for me. Converting values to different data types in order fit in the graphs was challenging for me.
Procedure:
The very first thing I did is to create a class to manage important functions for converting data types and reading data from the external file. The data class constructor is retrieving data from the external file and then splitting the data based on splitter value. Each row contains year and population data and all rows are storing in a 2D array.
The data class contains functions which convert int values to float and float to int data types in order to fit in the graph. I override the functions with different parameter values for conversion from one type to another. I worked with indexing to get and return the right value from the 2D array.
Then I initialized a color array and fill up with color hex values. I initialized the data class object in the setup function and pass the external file name as parameter into it. I called the getRowCount function to get the number of rows which is year count.
In draw function, I am setting the background of the screen and setting the stroke weight to 230. Then I am aligning center and setting text for the graph title with text size 20. Then I initialized for loop in draw function which iterates till number of years ranges from 1951 to 2019. Then rounding the population value by 1000000 to get the value in float in order to represent on the graph. Then I worked on mouse movement on graph and prompting text which contains the population rounded value and year.
Below I attached my final code
class Data
{

  int nrows;
  String[][] data;

  Data(String filename)
  {
    String[] rows = loadStrings(filename);
    data = new String[rows.length][];

    for (int i = 0; i < rows.length; i++)
    {
      // split the row on the tabs
      String[] datasplit = split(rows[i], TAB);
      // copy to the Data array
      data[nrows] = datasplit;
      nrows++;

    }
    // resize the 'data' array as necessary
    data = (String[][]) subset(data, 0, nrows);
  }


  int getRowCount()
  {
    return nrows;
  }


  // find a row by its name, returns -1 if no row found
  int getRowIndex(String name)
  {
    for (int i = 0; i < nrows; i++)
    {
      if (data[i][0].equals(name))
      {
        return i;
      }
    }
    return -1;
  }


  String getRowName(int row)
  {
    return getString(row, 0);
  }


  String getString(int rowIndex, int column)
  {
    return data[rowIndex][column];
  }


  String getString(String rowName, int column)
  {
    return getString(getRowIndex(rowName), column);
  }


  int getInt(String rowName, int column)
  {
    return parseInt(getString(rowName, column));
  }


  int getInt(int rowIndex, int column)
  {
    return parseInt(getString(rowIndex, column));
  }


  float getFloat(String rowName, int column)
  {
    return parseFloat(getString(rowName, column));
  }


  float getFloat(int rowIndex, int column)
  {
    return parseFloat(getString(rowIndex, column));
  }


  void setRowName(int row, String what)
  {
    data[row][0] = what;
  }


  void setString(int rowIndex, int column, String what)
  {
    data[rowIndex][column] = what;
  }


  void setString(String rowName, int column, String what)
  {
    int rowIndex = getRowIndex(rowName);
    data[rowIndex][column] = what;
  }


  void setInt(int rowIndex, int column, int what)
  {
    data[rowIndex][column] = str(what);
  }


  void setInt(String rowName, int column, int what)
  {
    int rowIndex = getRowIndex(rowName);
    data[rowIndex][column] = str(what);
  }


  void setFloat(int rowIndex, int column, float what)
  {
    data[rowIndex][column] = str(what);
  }


  void setFloat(String rowName, int column, float what)
  {
    int rowIndex = getRowIndex(rowName);
    data[rowIndex][column] = str(what);
  }

}

color[] palette = {#133463, #365FB7, #799AE0, #F4EFDC, #BA9B65};

Data populationData;
int nrows;
float mx = 79;
int opacity = 20;
int ellipseColor = 225;

void setup()
{
  size(1000, 600);
  populationData = new Data("KSAPopulation.tsv");
  nrows = populationData.getRowCount();
}

void draw()
{
  background(153);
  stroke(230);
  fill(230);
  textAlign(CENTER);
  textSize(20);
  text("Population of Saudia Arabia by year", width/2, 30);

  textAlign(LEFT);

  //read Data for population of each year:
  for(int row = 0; row < nrows; row++)
  {
    int years = populationData.getInt(row, 0);
    float populations = populationData.getFloat(row, 1);
    float x = map(populations, 8570449, 29709449, 80, width-80);
    float y = map(years, 2019, 1951, 80, height-180);
    float x2 = map(row, 0, 69, 80, width-80);

    float roundedPopulations = populations/1000000;

    if(years % 10 == 1)
    {
       line(x, y, width-90, y);
       fill(palette[0], opacity);
       noStroke();
       quad(x, y, width-80, y, width-80, height-80, x, height-80);
    }

    //X-axis label lines
    line(x2, height-80, x2, height-85);

    //X-axis text in difference of 10
    if((row % 10 == 0) || (row == 69))
    {
      stroke(255);
      fill(255);
      text(roundedPopulations, x2-20, height-60);
    }

    if((years == 1951) || (years == 2019))
    {
      text(years, x2-40, y);
      line(x2, y, x2, height-85);
    }

    //Information Line - with Interaction
    if((mx > 80) && (mx < width-80))
    {
      if(abs(mx - x) < 7)
      {
        strokeWeight(2);
        line(mx, y, mx, height-80);
        fill(palette[3]);
        text(years, mx+10, y-65);
        text(roundedPopulations, mx + 6, y-45);
      }
    }

     //Ellipse dot

     stroke(ellipseColor);
     int d = 7;
     fill(ellipseColor);
     ellipse(x, y, d, d);
    }

  }


void mouseMoved()
{
  mx = mouseX;
}
Final work:
Conclusion:
I learned how to draw a graph and represent numerical values on it. Gives me opportunity to work on 2D arrays. I learned how to convert one data type to another. I experienced text rendering on graphs. I learned ow to get and set 2D array indexes. Helps me to build my logic on data visualization. I learned how to override functions with same name but different parameters. I learned how to manipulate for loop iterations on a series of data and check for different conditions in order to represent data on graphs.
I created this piece to demonstrate how relatively easy to fall into old habits and spiral downward and, on the flip side, how difficult it is to recover, relapse, and then get clean again.
PROCESS
First I made these two sentences exploded. With every DOWN key pressed, the alphabets move faster and it gets darker until it’s completely pitch black.
Then, if you start clicking the UP button, the background begins to get brighter and the alphabets begin to shrink. Until it suddenly cuts to black, and then it brightens up, with the words too small to register.
DEMO
CODES
// a string of text
String s = "stupid mistake ";
String t = "why did you do?";

// declare an array of Circle objects, called letters
// set it to be the same size as the length of the String
Letter letters[] = new Letter[s.length()];
Letter letters1[] = new Letter[t.length()];

PFont f;
int fontSize = 25;
int bg = 255;

void setup(){
  size(450, 450);
  f = createFont("Skia-Regular_Black-Extended", 25);
  textFont(f);

  // radius of the  circle of letters
  int radius = 50;
  int radius1 = 75;

  // start the words halfway around the circle
  // (left side. normally in processing circles, angles, and rotations
  // start on the right side)
  float startingAngle = PI;

  // where is the center of the circle
  float circleCenterX = width/2;
  float circleCenterY = height/2;

  // loop through all the characters in the String
  for (int i =0; i<s.length();i++){
     // the get the angle using i as a multiplier
     float angle = startingAngle + i*TWO_PI/s.length();

     // cosine of an angle equals adjacent/hypoteneuse
     // thus: cos(angle) = x/radius
     // and algebra: x = cos(angle)*radius
     float x = cos(angle)*radius + circleCenterX+random(-2, 2)*noise(frameCount*.01);
     // y is same but sine
     float y = sin(angle)*radius + circleCenterY+random(-2, 2)*noise(frameCount*.01);

     //make a new Circle object for each letter
     letters[i] = new Letter(x, y, s.charAt(i));
  }

   for (int l =0; l<t.length();l++){
     // the get the angle using i as a multiplier
     float angle = startingAngle + l*TWO_PI/t.length();

     // cosine of an angle equals adjacent/hypoteneuse
     // thus: cos(angle) = x/radius
     // and algebra: x = cos(angle)*radius
     float x1 = cos(angle)*radius1 + circleCenterX;
     // y is same but sine
     float y1 = sin(angle)*radius1 + circleCenterY;

     //make a new Circle object for each letter
     letters1[l] = new Letter(x1, y1, t.charAt(l));
  }
}

void draw(){
  background(bg);
  textSize(fontSize);
  // loop through the letters array and call all needed functions
  for (int i =0; i<s.length();i++){
     letters[i].update();
     letters[i].display();
     letters[i].checkEdges();
     letters1[i].update();
     letters1[i].display();
     letters1[i].checkEdges();
  }
}

// when the down and up key is pressed assign a random x & y speed and changes background color
void keyPressed(){
  if (key == CODED && keyCode == DOWN){
       for (int i =0; i<s.length();i++){
        letters[i].xSpeed = random(-5*i,5)*noise(frameCount*.01+i*0.01);
        letters[i].ySpeed = random(-5,5*i)*noise(frameCount*.01+i*0.01);
        letters1[i].xSpeed = random(-5,5*i)*noise(frameCount*.01+i*0.01);
        letters1[i].ySpeed = random(-5*1,5)*noise(frameCount*.01+i*0.01);
        }
        fontSize += 25;
        bg -=20;
          if (bg<30){
        bg = 0;
        }
  }
    else if (key == CODED && keyCode == UP){
        for (int i =0; i<s.length();i++){
          letters[i].xSpeed = random(-5/(i+1),5/(i+1))*noise(frameCount*.01+i*0.01);
          letters[i].ySpeed = random(-5/(i+1),5/(i+1))*noise(frameCount*.01+i*0.01);
          letters1[i].xSpeed = random(-5/(i+1)/(i+1),5)*noise(frameCount*.01+i*0.01);
          letters1[i].ySpeed = random(-5/(i+1),5/(i+1))*noise(frameCount*.01+i*0.01);
        }
        if (bg <255){
          bg += 10;
        }
        else {
            bg = 255;
          }
        if(fontSize >=5){
          fontSize -= 10;
        }
        else {
          fontSize = 1;
        }
  }
}
class Letter {
  float x, y;
  float xSpeed, ySpeed;
  char letter;
  int fontSize;

  Letter(float _x, float _y, char _c) {
    x = _x;
    y = _y;
    xSpeed = ySpeed = 0;
    letter = _c;
  }

  void update() {
    x += xSpeed;
    y += ySpeed;
    xSpeed *= .90;
    ySpeed *= .90;
  }

  void display() {
    fill(0);
    text(letter,x,y);
  }

  void checkEdges() {
    if (y>height) {
      y=0;
    }
    if (y<0) {
      y=height;
    }
    if (x>width) {
      x=0;
    }
    if (x<0) {
      x=width;
    }
  }
}
In week 4, we must brainstorm on some creative ideas to visualize and see an insight of data visualization. Data visualization plays a vital role in processing and analyzing data. The new era is of big data and the only way to get knowledge from data is through graphs and charts. So Processing is ideal as it allows us to manipulate and simulate the data and draw various graphs based on our own requirements.
INSPIRATION BEHIND DATA VISUALIZATION:
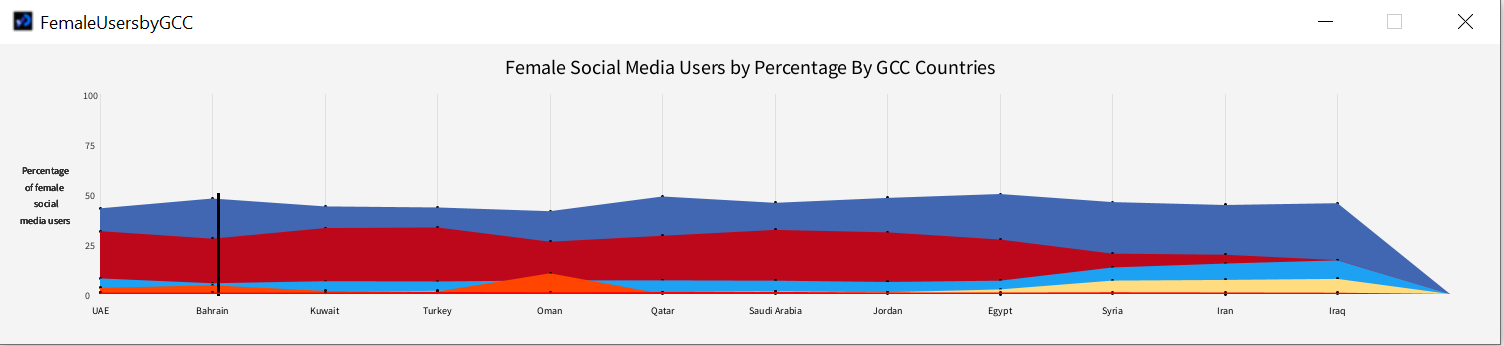
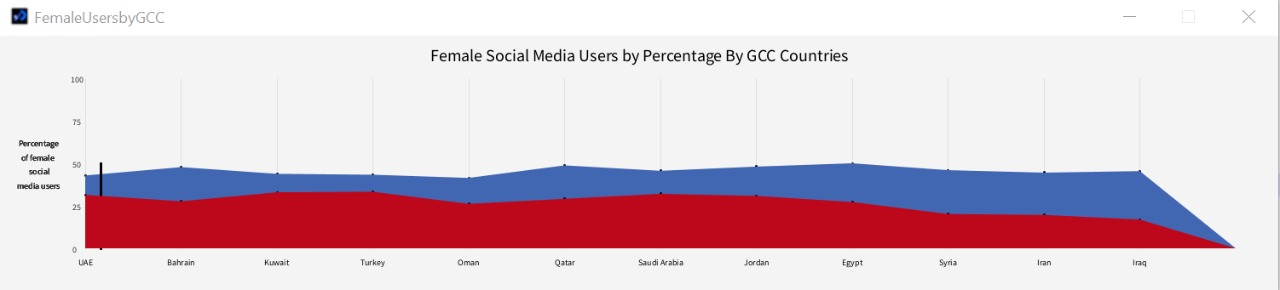
The idea comes into visualization by comparing Gulf countries in terms of female users on social media. There are numerous social media platforms, and, on every platform, we have number of active users by gender. Based on the above facts, I decided to visualize active female users on different social media platforms in different gulf countries. This stems from the fact that in previous generations, the society in the Middle East was more conservative in terms of allowing girls to engage and interact on social media. As a Middle Eastern woman, I found it to be interesting to statistically show how this mindset changed throughout recent generations. Google trends was a part of my research as it shows that females are more active on social media platforms rather than males.
CHALLENGES & PROBLEMS:
The generation of data for active female users on different social media platforms was challenging for me due to data ambiguity on the internet. Preprocessing of data was another challenge too. To sort out this issue, I converted csv format dataset into tab separated format to preprocess the values in a convenient way. It was difficult for me to find the maximum and minimum number of female active social media users from the data to draw graph points. The labeling was somehow easy but drawing area for each social media platform was a hurdle.
PROCEDURE:
Based on the previous knowledge of classes and object oriented, I started by implementing classes which supports me further to manage my code while visualizing the data. I implemented the dataset class and its main purpose was to read and preprocess the data before visualizing the data. The class contained some important attributes which further stored different values from the dataset.
class Dataset
{

  //Atribute for Number Of rows
  int NumberOfRows;
  //Attribute for Number of columns
  int NumberOfColumns;
  //2D array for getting social media users percentage data
  float[][] SocialData;
  //For getting name of rows
  String[] NameOfRows;
  //For getting GCC countries names
  String[] GCCCountries;
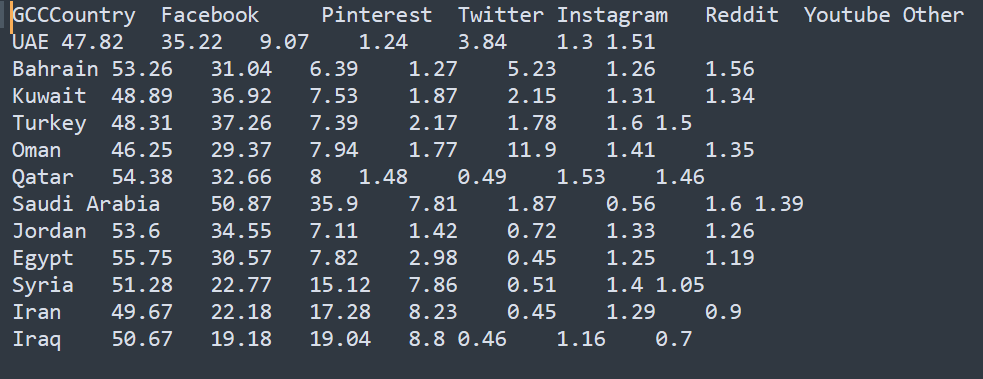
The dataset is in tabular format and is tab delimited. The first row contains column names. The first column contains GCC countries names. While the float values represent active social media female user’s percentage.
The dataset function is taking the file name as a parameter and loading all the lines in a string array. Then we further split it by tab and get the columns which is at first row. I store GCC Countries names in the class attribute named as GCCCountries. Then, did a preprocessing on the data present in the attributes to remove unnecessary spaces and quotations. By doing so, I got the number of columns and number of rows in this function.
//Function to read data from the tsv (Tab Seperated File) file
 //Parameter is filename
 Dataset(String filename)
 {
   //storing rows in string array
   String[] rows = loadStrings(filename);

   //Getting column names
   String[] columns = split(rows[0], TAB);
   //Getting GCC Countries Names
   GCCCountries = subset(columns, 1);
   //Pre processing on GCC Countries
   Preprocessing(GCCCountries);
   //for Countires Count
   NumberOfColumns = GCCCountries.length;

   //For name of each row
   NameOfRows = new String[rows.length-1];
   //For Social Data
   SocialData = new float[rows.length-1][];

   // We are ignoring first column as it containes headers
   for (int i = 1; i < rows.length; i++)
    {
     // Spliting row based on Tab
     String[] pieces = split(rows[i], TAB);
     //Pre processing on row data
     Preprocessing(pieces);

     // Getting row name
     NameOfRows[NumberOfRows] = pieces[0];
     // Getting social media users data
     SocialData[NumberOfRows] = parseFloat(subset(pieces, 1));

     // incrementing rows
     NumberOfRows++;
   }
   // adding more storage in social data varible
   SocialData = (float[][]) subset(SocialData, 0, NumberOfRows);
 }
In the preprocessing function, I am passing an array containing active social media female user’s percentage values. In other words, I am checking if the values are quoted, and then removing the quotes from the values.
// for pre processing the dataset. removing unecessary quotations and spacing
  void Preprocessing(String[] array)
  {
    for (int i = 0; i < array.length; i++)
    {
      if (array[i].length() > 2)
      {
        if (array[i].startsWith("\"") && array[i].endsWith("\""))
        {
          array[i] = array[i].substring(1, array[i].length() - 1);
        }
      }
      array[i] = array[i].replaceAll("\"\"", "\"");
    }
  }
Then we have small getter functions which returns class attribute values. These functions aid in the code reusability.
//For getting number of rows
 int getNumberOfRows()
 {
   return NumberOfRows;
 }

 //For getting row names
 String getRowName(int rowIndex)
 {
   return NameOfRows[rowIndex];
 }

 //for getting social media platform names
 String[] getNameOfRows()
 {
   return NameOfRows;
 }
Moving forward, I implemented the function to get which GCC country has the minimum active female social media users. I am passing the social platform index to check for minimum value.
//Getting the minimum number female users on social media platform
 float MinimumColumn(int col)
 {
   float m = Float.MAX_VALUE;
   for (int i = 0; i < NumberOfRows; i++)
   {
     if (!Float.isNaN(SocialData[i][col]))
     {
       if (SocialData[i][col] < m)
       {
         m = SocialData[i][col];
       }
     }
   }
   return m;
 }
Later, I calculated which GCC country has maximum active female social media users and passed the social media index as a parameter. Moreover, inside the for loop, I am checking if the new value is greater than previous one, then updating the temp m variable which contains maximum value.
//Getting the maximum number female users on social media platform
  float MaximumColumn(int col)
  {
    float m = -Float.MAX_VALUE;
    for (int i = 0; i < NumberOfRows; i++)
    {
      if (isValid(i, col))
      {
        if (SocialData[i][col] > m)
        {
          m = SocialData[i][col];
        }
      }
    }
    return m;
  }
Afterwards, I implemented maximum and minimum values based on social media platforms. Each GCC country has multiple social media platforms and, in these functions, calculation of which social media has minimum active female users and which has maximum social media users is done.
//Getting GCC Country which has lowest female users on social media platforms
  float MinimumRow(int row)
  {
    float m = Float.MAX_VALUE;
    for (int i = 0; i < NumberOfColumns; i++)
    {
      if (isValid(row, i))
      {
        if (SocialData[row][i] < m)
        {
          m = SocialData[row][i];
        }
      }
    }
    return m;
  }


//Getting GCC Country which has highest female users on social media platforms
float MaximumRow(int row)
{
float m = -Float.MAX_VALUE;
for (int i = 1; i < NumberOfColumns; i++)
{
if (!Float.isNaN(SocialData[row][i]))
{
if (SocialData[row][i] > m)
{
m = SocialData[row][i];
}
}
}
return m;
}
Next, I implemented class for social platform. This class supports in drawing areas and value points. In addition, I initialized attributes to store min and max values, countries count and social platforms count.
public class SocialPlatform
{

  //Initializing object of female users count on social media platforms by GCC countries
  Dataset FemaleUsers;

  //Attributes for maximum and minimum count
  float dataMin, dataMax;
  String datesMin, datesMax;

  // for number of rows and number of columns
  int rowCount, columnCount;
  int columnNumber;
  String GCCCountries[];

  // Attributes for plotting graphs
  float plotX1, plotY1, plotX2, plotY2;

  //For coloring the graph
  color hexcode;
The social platform function is drawing area on the screen for each social media platform with specified color. The color value and social media platform index is passed as parameter.
//function to draw social platform insight with color
  SocialPlatform(color hexcode, int columnNumber)
  {
  //saving the color of social platform
  this.hexcode = hexcode;
  //for column number
  this.columnNumber = columnNumber;

  //For female Social Media users
  FemaleUsers = new Dataset("SocialMediaUsersFemales.tsv");
  //for row and column count
  rowCount = FemaleUsers.getNumberOfRows();
  columnCount = FemaleUsers.getNumberOfColumns();

  //getting GCC country
  GCCCountries = FemaleUsers.getNameOfRows();
  //getting maximum and minimum value of female users on social media with respect to GCC Country
  datesMin = GCCCountries[0];
  datesMax = GCCCountries[GCCCountries.length-1];


  dataMin = FemaleUsers.MinimumTable();
  dataMax = FemaleUsers.MaximumTable();

  //How much gap from the left of the screen
  plotX1 = 50;
  //Gap from the top of the screen
  plotY1 = 150;
  plotX2 = width - plotX1;
  plotY2 = height - 50;

  DrawFemaleUsersPoints(this.columnNumber);
  DrawAreaofFemaleUsersbyMedia(this.columnNumber);
  mouseMoved();
}
Here I am drawing points to show the active females social media users on graph. When the mouse hovers to the point, then the percentage value pops up with the social platform name.
In the main program, initializing objects for each social media platform is created. Then, I called relevant functions to draw areas and points of each social media platform.
In draw function, I initialized each social media platform with a different color. Drawing countries label and female users labels on x and y axis of graph.
void draw()
{
background(244);
title();
DrawGCCCountriesLabels();
DrawFemaleUsersLabel();
smooth();
facebook = new SocialPlatform(#4267B2, 0);
pinterest = new SocialPlatform(#BD081C, 1);
twitter = new SocialPlatform(#1DA1F2, 2);
instagram = new SocialPlatform(#FFDC80, 3);
reddit = new SocialPlatform(#FF4500, 4);
youtube = new SocialPlatform(#FF0000, 5);
}
COMPLETE CODE ATTACHED BELOW:
class Dataset
{
//Atribute for Number Of rows
int NumberOfRows;
//Attribute for Number of columns
int NumberOfColumns;
//2D array for getting social media users percentage data
float[][] SocialData;
//For getting name of rows
String[] NameOfRows;
//For getting GCC countries names
String[] GCCCountries;
//Function to read data from the tsv (Tab Seperated File) file
//Parameter is filename
Dataset(String filename)
{
//storing rows in string array
String[] rows = loadStrings(filename);
//Getting column names
String[] columns = split(rows[0], TAB);
//Getting GCC Countries Names
GCCCountries = subset(columns, 1);
//Pre processing on GCC Countries
Preprocessing(GCCCountries);
//for Countires Count
NumberOfColumns = GCCCountries.length;
//For name of each row
NameOfRows = new String[rows.length-1];
//For Social Data
SocialData = new float[rows.length-1][];
// We are ignoring first column as it containes headers
for (int i = 1; i < rows.length; i++)
{
// Spliting row based on Tab
String[] pieces = split(rows[i], TAB);
//Pre processing on row data
Preprocessing(pieces);
// Getting row name
NameOfRows[NumberOfRows] = pieces[0];
// Getting social media users data
SocialData[NumberOfRows] = parseFloat(subset(pieces, 1));
// incrementing rows
NumberOfRows++;
}
// adding more storage in social data varible
SocialData = (float[][]) subset(SocialData, 0, NumberOfRows);
}
// for pre processing the dataset. removing unecessary quotations and spacing
void Preprocessing(String[] array)
{
for (int i = 0; i < array.length; i++)
{
if (array[i].length() > 2)
{
if (array[i].startsWith("\"") && array[i].endsWith("\""))
{
array[i] = array[i].substring(1, array[i].length() - 1);
}
}
array[i] = array[i].replaceAll("\"\"", "\"");
}
}
//For getting number of rows
int getNumberOfRows()
{
return NumberOfRows;
}
//For getting row names
String getRowName(int rowIndex)
{
return NameOfRows[rowIndex];
}
//for getting social media platform names
String[] getNameOfRows()
{
return NameOfRows;
}
//for getting row index based on social media platform name
int getRowIndex(String name)
{
for (int i = 0; i < NumberOfRows; i++)
{
if (NameOfRows[i].equals(name))
{
return i;
}
}
return -1;
}
//for getting number of columns
int getNumberOfColumns()
{
return NumberOfColumns;
}
//for getting column name
String getColumnName(int colIndex)
{
return GCCCountries[colIndex];
}
//for getting GCC countries list
String[] getGCCCountries()
{
return GCCCountries;
}
//getting female social media users value which is in percentage as float value
float getFloat(int rowIndex, int col)
{
return SocialData[rowIndex][col];
}
//checking of the value is valid
boolean isValid(int row, int col)
{
if (row < 0)
{
return false;
}
if (row >= NumberOfRows)
{
return false;
}
if (col >= SocialData[row].length)
{
return false;
}
if (col < 0)
{
return false;
}
return !Float.isNaN(SocialData[row][col]);
}
//Getting the minimum number female users on social media platform
float MinimumColumn(int col)
{
float m = Float.MAX_VALUE;
for (int i = 0; i < NumberOfRows; i++)
{
if (!Float.isNaN(SocialData[i][col]))
{
if (SocialData[i][col] < m)
{
m = SocialData[i][col];
}
}
}
return m;
}
//Getting the maximum number female users on social media platform
float MaximumColumn(int col)
{
float m = -Float.MAX_VALUE;
for (int i = 0; i < NumberOfRows; i++)
{
if (isValid(i, col))
{
if (SocialData[i][col] > m)
{
m = SocialData[i][col];
}
}
}
return m;
}
//Getting GCC Country which has lowest female users on social media platforms
float MinimumRow(int row)
{
float m = Float.MAX_VALUE;
for (int i = 0; i < NumberOfColumns; i++)
{
if (isValid(row, i))
{
if (SocialData[row][i] < m)
{
m = SocialData[row][i];
}
}
}
return m;
}
//Getting GCC Country which has highest female users on social media platforms
float MaximumRow(int row)
{
float m = -Float.MAX_VALUE;
for (int i = 1; i < NumberOfColumns; i++)
{
if (!Float.isNaN(SocialData[row][i]))
{
if (SocialData[row][i] > m)
{
m = SocialData[row][i];
}
}
}
return m;
}
//Getting the minimum female users on social media platform in a table
float MinimumTable()
{
float m = Float.MAX_VALUE;
for (int i = 0; i < NumberOfRows; i++)
{
for (int j = 0; j < NumberOfColumns; j++)
{
if (isValid(i, j))
{
if (SocialData[i][j] < m)
{
m = SocialData[i][j];
}
}
}
}
return m;
}
//Getting the maximum female users on social media platform in a table
float MaximumTable()
{
float m = -Float.MAX_VALUE;
for (int i = 0; i < NumberOfRows; i++)
{
for (int j = 0; j < NumberOfColumns; j++)
{
if (isValid(i, j))
{
if (SocialData[i][j] > m)
{
m = SocialData[i][j];
}
}
}
}
return m;
}
}
public class SocialPlatform
{
//Initializing object of female users count on social media platforms by GCC countries
Dataset FemaleUsers;
//Attributes for maximum and minimum count
float dataMin, dataMax;
String datesMin, datesMax;
// for number of rows and number of columns
int rowCount, columnCount;
int columnNumber;
String GCCCountries[];
// Attributes for plotting graphs
float plotX1, plotY1, plotX2, plotY2;
//For coloring the graph
color hexcode;
float mx, my;
//function to draw social platform insight with color
SocialPlatform(color hexcode, int columnNumber)
{
//saving the color of social platform
this.hexcode = hexcode;
//for column number
this.columnNumber = columnNumber;
//For female Social Media users
FemaleUsers = new Dataset("SocialMediaUsersFemales.tsv");
//for row and column count
rowCount = FemaleUsers.getNumberOfRows();
columnCount = FemaleUsers.getNumberOfColumns();
//getting GCC country
GCCCountries = FemaleUsers.getNameOfRows();
//getting maximum and minimum value of female users on social media with respect to GCC Country
datesMin = GCCCountries[0];
datesMax = GCCCountries[GCCCountries.length-1];
dataMin = FemaleUsers.MinimumTable();
dataMax = FemaleUsers.MaximumTable();
//How much gap from the left of the screen
plotX1 = 50;
//Gap from the top of the screen
plotY1 = 150;
plotX2 = width - plotX1;
plotY2 = height - 50;
DrawFemaleUsersPoints(this.columnNumber);
DrawAreaofFemaleUsersbyMedia(this.columnNumber);
mouseMoved();
}
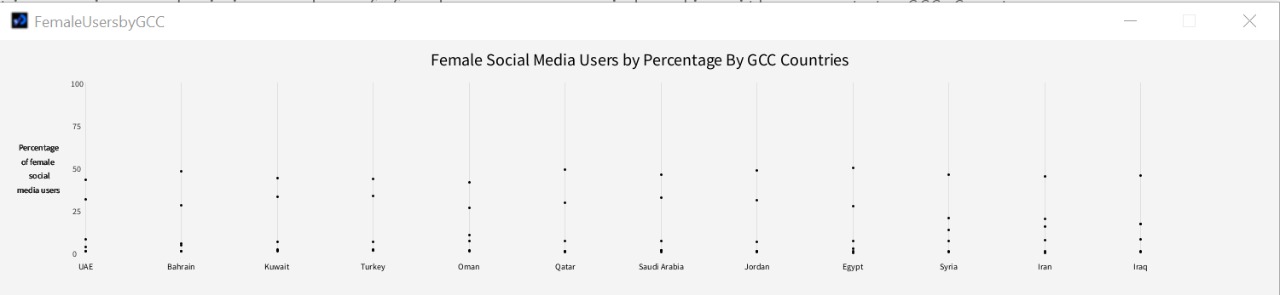
void DrawFemaleUsersPoints(int col)
{

  // for row count
  int rowCount = FemaleUsers.getNumberOfRows();

  for(int row = 0; row < rowCount; row++)
  {
    float value = FemaleUsers.getFloat(row, col);
    String mediaName = FemaleUsers.getColumnName(col);
    float x = map(row, 0, 12, 100, width - 50);
    float y = map(value, dataMin, dataMax, plotY2, plotY1);
    stroke(0);
    strokeWeight(3);
    point(x, y);
    mouseMoved();
    if((mx>100) && (mx<(width-50)))
     {
      stroke(2);
      strokeWeight(2);
      line(mx, plotY2, mx, plotY1);
      println("x: " + x + " y: " + y);
      if((abs(mx-x) < 5) && (abs(my-y) < 5))
      {
        fill(0);
        textSize(15);
        text(mediaName, mx+26, my-40);
        text(value+"%", mx+26, my-20);
      }
    }

    }
}
void DrawAreaofFemaleUsersbyMedia(int col)
{
fill(this.hexcode);
noStroke();
beginShape();
int rowCount = FemaleUsers.getNumberOfRows();
for (int row = 0; row < rowCount; row++)
{
float value = FemaleUsers.getFloat(row, col);
float x = map(row, 0, 12, 100, width - 50);
float y = map(value, dataMin, dataMax, plotY2, plotY1);
vertex(x, y);
}
// Draw the lower-right and lower-left corners.
vertex(plotX2, plotY2);
vertex(100, plotY2);
endShape(CLOSE);
}
void mouseMoved()
{
mx = mouseX;
my = mouseY;
}
}
 Dataset FemaleUsers;


  float dataMin, dataMax;
  String datesMin, datesMax;

  int rowCount, columnCount;
  int columnNumber;
  String GCCCountries[];

  float plotX1, plotY1, plotX2, plotY2;

  String hexcode;

  float mx, my;


SocialPlatform facebook;
SocialPlatform twitter;
SocialPlatform pinterest;
SocialPlatform instagram;
SocialPlatform youtube;
SocialPlatform reddit;
void setup()
{
size(1500, 300);
smooth();
FemaleUsers = new Dataset("SocialMediaUsersFemales.tsv");
rowCount = FemaleUsers.getNumberOfRows();
//For Social Media
FemaleUsers = new Dataset("SocialMediaUsersFemales.tsv");
rowCount = FemaleUsers.getNumberOfRows();
columnCount = FemaleUsers.getNumberOfColumns();
GCCCountries = FemaleUsers.getNameOfRows();
datesMin = GCCCountries[0];
datesMax = GCCCountries[GCCCountries.length-1];
dataMin = FemaleUsers.MinimumTable();
dataMax = FemaleUsers.MaximumTable();
//How much gap from the left of the screen
plotX1 = 50;
//Gap from the top of the screen
plotY1 = 150;
plotX2 = width - plotX1;
plotY2 = height - 50;
}
void draw()
{
background(244);
title();
DrawGCCCountriesLabels();
DrawFemaleUsersLabel();
smooth();
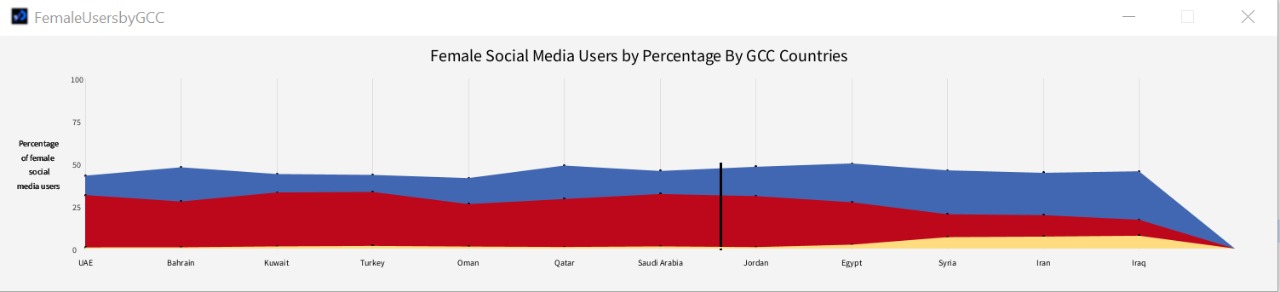
facebook = new SocialPlatform(#4267B2, 0);
pinterest = new SocialPlatform(#BD081C, 1);
twitter = new SocialPlatform(#1DA1F2, 2);
instagram = new SocialPlatform(#FFDC80, 3);
reddit = new SocialPlatform(#FF4500, 4);
youtube = new SocialPlatform(#FF0000, 5);
}
void title()
{
fill(0);
textAlign(CENTER);
textSize(20);
text("Female Social Media Users by Percentage By GCC Countries", width/2, 30);
}
void DrawGCCCountriesLabels()
{
fill(0);
textSize(10);
textAlign(CENTER, TOP);
stroke(224);
strokeWeight(1);
int rowCount = FemaleUsers.getNumberOfRows();
for(int row = 0; row < rowCount; row++)
{
float x = map(row, 0, 12, 100, width-50);
text(GCCCountries[row], x, plotY2 + 10);
line(x, 50, x, plotY2);
}
}
void DrawFemaleUsersLabel()
{
fill(50);
textSize(10);
textAlign(RIGHT, CENTER);
for (float p = 0; p < 101; p += 25)
{
float y = map(p, 0, 100, plotY2, 50);
text(int(p), plotX1 + 40, y);
textSize(10);
textAlign(CENTER, CENTER);
text("Percentage\nof female \n social\nmedia users",45, height/2);
}
}
FINAL WORK:
CONCLUSION:
The assignment made me explore how to manipulate data and visualize it in a knowledgeable way with the use of object-oriented programming. I learned to plot graph areas and the basic of graphs and charts. Not only did I familiarize myself with how to collect data and prepare it for data visualization, but also on how to display and manipulate with text and strings in processing.
In this project, I referred to some works of Professor Aaron and added some ideas. The project is about various flowers of different colors made up by texts.
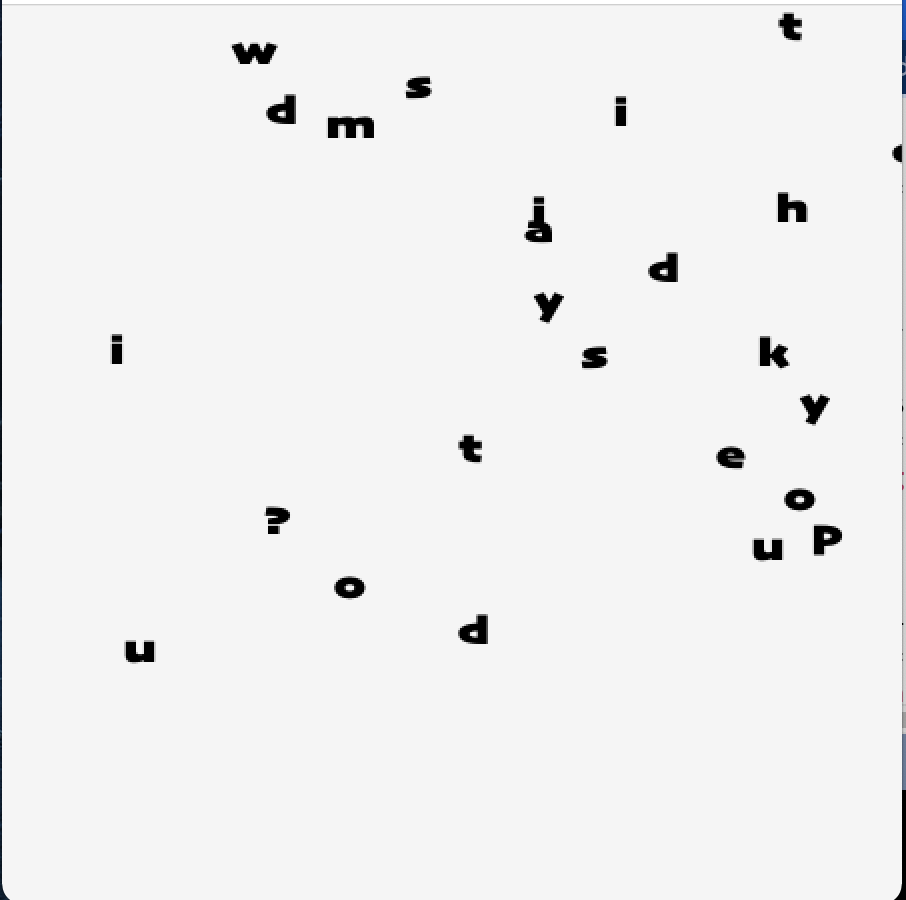
For the interaction part, if you press “W”, a new flower will be added at mouse coordinate, and if you press “S”, a random flower will be deleted. Pressing “R” will restart the program. There are two modes designed in the program. By default, when you put the cursor around the texts, they move away. Clicking the mouse will change the mode. In this mode, the texts will randomly move around.
Code
Mover is the foundation class of my program, which I referred to Professor Aaron’s text example and modified some parts. Every alphabet of a string is a Mover.The Mover class includes the physical attributes like speed, acceleration and gravity.
class Mover{
  PVector velocity;
  PVector gravity;
  PVector position;
  PVector acceleration;
  PVector wind;
  float drag;
  float mass;
  float hDampening;
  PVector speed;

  Mover(PVector pos, float _mass, PVector _speed){
    mass=_mass;
    position = pos;
    speed = _speed;
    velocity = new PVector(0,0);
    acceleration = new PVector(0,0);
    gravity = new PVector(0, 0.1*mass);
    drag = map(mass,15, 80, .999, .96);
    wind = new PVector(0,0);
    set_hDampening();
  }

  void move() {
    position.add(speed);
    speed.x *= 0.98;
    speed.y *= 0.98;
    acc = new PVector(0, 0);
    bounds();
  }

  void update(){
    wind.x=globalWind1;
    wind.y=globalWind2;
    if (globalWind1==0)
    velocity.x*=hDampening;
    applyForce(wind);
    applyForce(gravity);
    velocity.add(acceleration);
    velocity.mult(drag);
    position.add(velocity);
    bounds();
    acceleration.mult(0);
  }

  void display(){
    ellipse(position.x,position.y,mass,mass);
  }

  void bounds(){
    if (position.x>width - 30)
      position.x=width - 30;
    if (position.x<0)
     position.x=0;
    if (position.y>height)
      position.y=height;
    if (position.y<45)
      position.y=45;
  }

  void set_hDampening(){
    hDampening=map(mass,0,100,.98,.96);
  }

  void applyForce(PVector force){
    PVector f = PVector.div(force, mass);
    acceleration.add(f);
  }


}
The most significant part of my project is the Flower class, which transforms letters into flowers. It basically concatenates the letters to form a circle and adds animations to the letters. The run function is for shifting between the two modes, and the generate function is for changing colors.
class Flower {
  float x, y;
  String s;
  PVector speed = new PVector(0,0);
  ArrayList<Letter> letters = new ArrayList<Letter>();

  Flower(String _s, float _x, float _y) {
    s = _s;
    x = _x;
    y = _y;
  }

  void show() {
    generate();
    run();
  }

  void mysetup() {
    for (int i=0; i<s.length(); i++) {
      char c = s.charAt(i);
      float radius = random(s.length()*15, s.length()*25);
      float angle = PI + i*TWO_PI/s.length();
      float posx = cos(angle)*radius + x;
      float posy = sin(angle)*radius + y;
      PVector pos = new PVector(posx, posy);
      letters.add(new Letter(pos, random(0.1, 0.3), c, speed));
    }
  }


  void mouse_pos(Mover object) {
    float x = object.position.x;
    float y = object.position.y;
    if (dist(mouseX, mouseY, x, y)<30) {
      acc = new PVector(cos(random(TWO_PI)),
      cos(random(TWO_PI)));
      speed.add(acc);
    }
  }


  void run() {
    if (bool) {
      for (int i=0; i<s.length(); i++) {
        mouse_pos(letters.get(i));
        letters.get(i).move();
        letters.get(i).display();
      }
    }

    if (!bool) {
      for (int i=0; i<s.length(); i++) {
        globalWind1 = random(-0.3, 0.3);
        globalWind2 = random(-0.35, 0.3);
        letters.get(i).update();
        letters.get(i).display();
      }
    }
  }

  void generate() {
    switch (s) {
    case "Rose":
      fill(#D8163A);
      break;
    case "Dandelion":
      fill(255);
      break;
    case "Sunflower":
      fill(#EFF70A);
      break;
    case "Daisy":
      fill(#E3A3E2);
      break;
    case "Carnation":
      fill(#F083E5);
      break;
    case "Iris":
      fill(#B44EB4);
      break;
    }
    mysetup();
  }

}
Below is my main function where I put parameters into the flower class, and design the interactions.
This project is pretty challenging as I have three classes connected with each other. It’s hard to organize these classes. Adding new features and animations can be painful because I have to also modify the classes, and it requires a clear mind and efforts. You can easily get an error message for not sorting things out.
For example, when I was trying to make alphabets randomly move by adding a variable globalWind to the Mover class, I encountered a problem that every alphabet moves towards the exactly same directions. My final solution was to add a speed parameter to flower class.
There is still a problem I haven’t solved. When I was trying to change the font, the intervals between alphabets are not evenly distributed. So some alphabets appear too close, but some are far away from each other. I don’t understand why — I think it should be displayed normally because my code was to calculate textWidth before locating the positions.
Overall, I think making this project improves my understanding of classes, especially how the parameters can help. It also helps me get grasp of the physics in Processing.
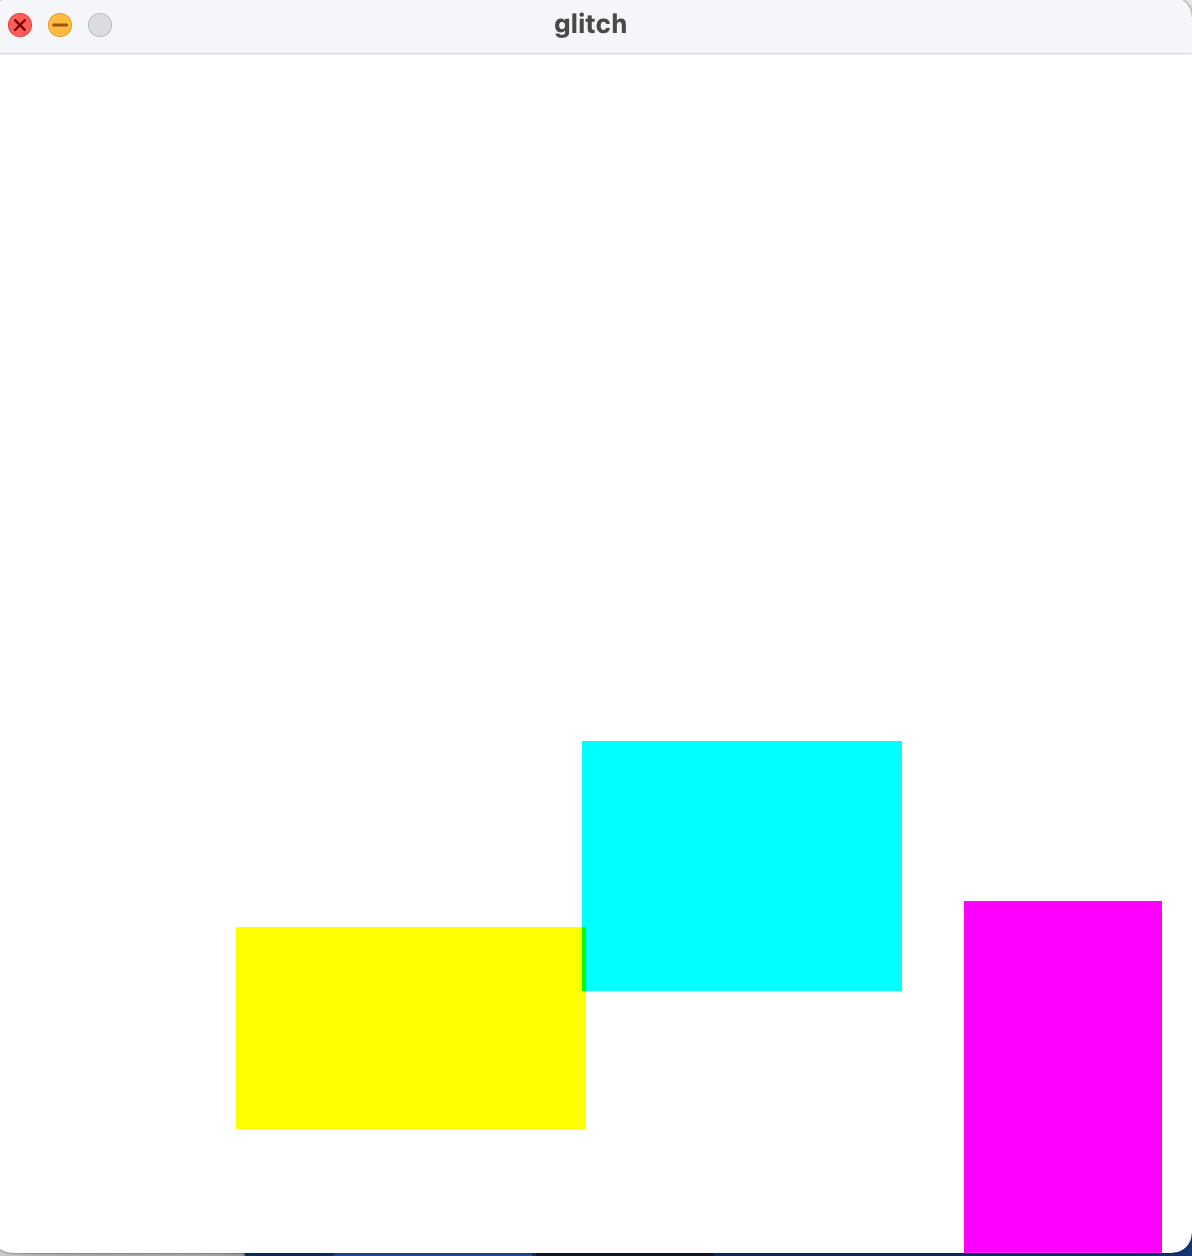
This week, we were tasked with making object-oriented generative artwork.
My idea was to make random colored rectangles appear at random places on screen, with the subtract blend mode on, so that when they overlap other colors show and create a ‘glitch’ effect.
I picked the subtract blend mode because I liked the way it looked :]
It should be slightly similar to this, but imagine squares on a white background instead ..
So I started working on my code. I made a class in a separate tab, and started making variables.
I made 3 functions; one for the red rectangle, one for the green, and one for the blue. I also made separate variables for each one rect.
Now I had my class, and I had my setup ready. I made a new object from my class and called the functions in void draw. Now, 3 rectangles of different sizes appeared on screen! It looked like this:
But then (with the help of professor & discord) I scrapped those 3 functions and made just one, with a for loop indicating how many rects should appear on screen. I made it so that 20 rects appear at once, and whenever you click the screen with your mouse, 20 more will appear. Also, their size and color is always random.
In the video, I experimented with both subtract and add blend modes , with white and black backgrounds, respectively.
Create a generative artwork using Object-Oriented Programming paying attention to the structure, clarity, and organization of your program.
Process
Saying goodbye to hardcoding was hard. How do I create a pleasing and satisfying to-watch art with little code? After hours of thinking, it finally clicked. Why not recreate the natural phenomena of the ripple effect. Throw a little stone into water and it creates a mighty ripple. Yeah that’s the inspiration
I started off by exploring how I can play with ellipses to form the shapes of the ripple effect. As I was working on this piece deep in the night, I kept on repeating the ” final countdown ” tune so I decided to create my whole art in a form of a play or an exhibition.
The Intro!
The introduction of my exhibition starts with a count down. The countdown is actually a count up 🙂 which is centered in the middle of the screen. I then added the ripple effect. I added some colors to appeal to the eye
The Interlude!
Now we can kill some time by watching balls bouncing off walls and changing colors. Used some opacity to achieve a lightsaber effect.
The Playback!
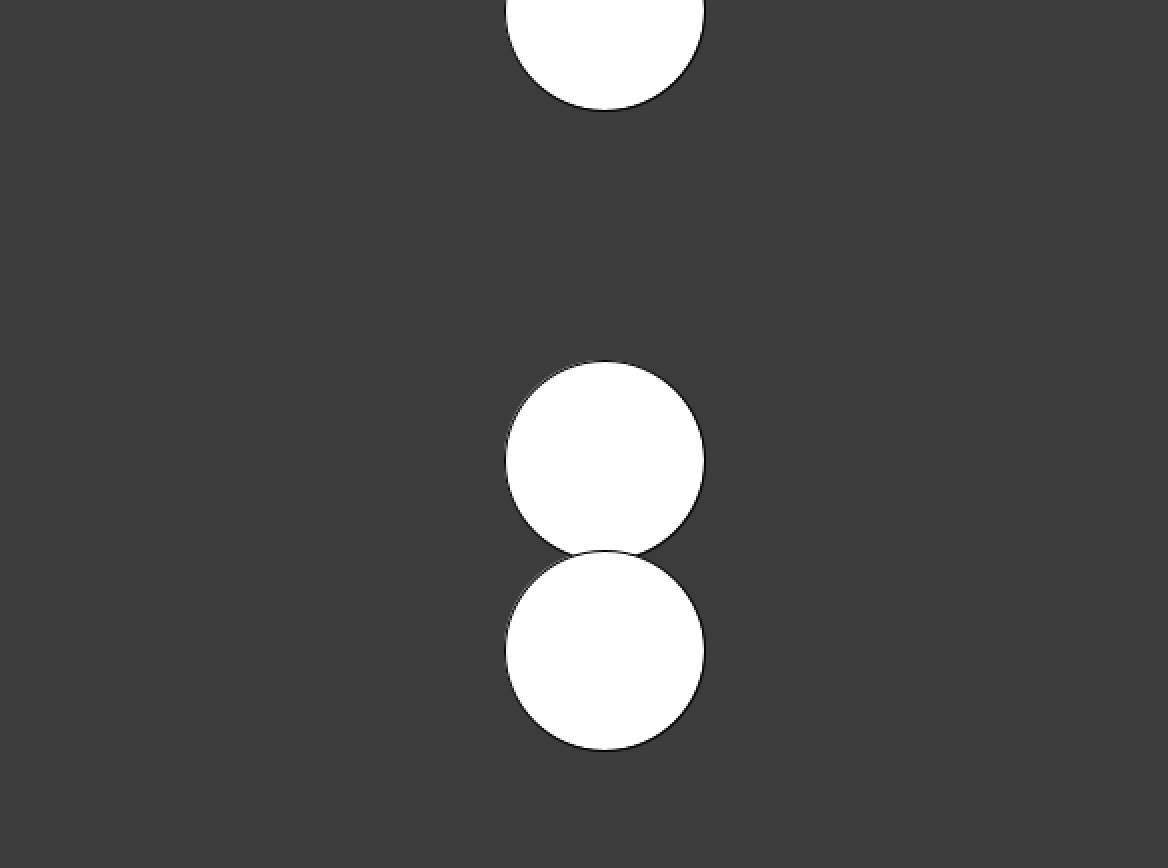
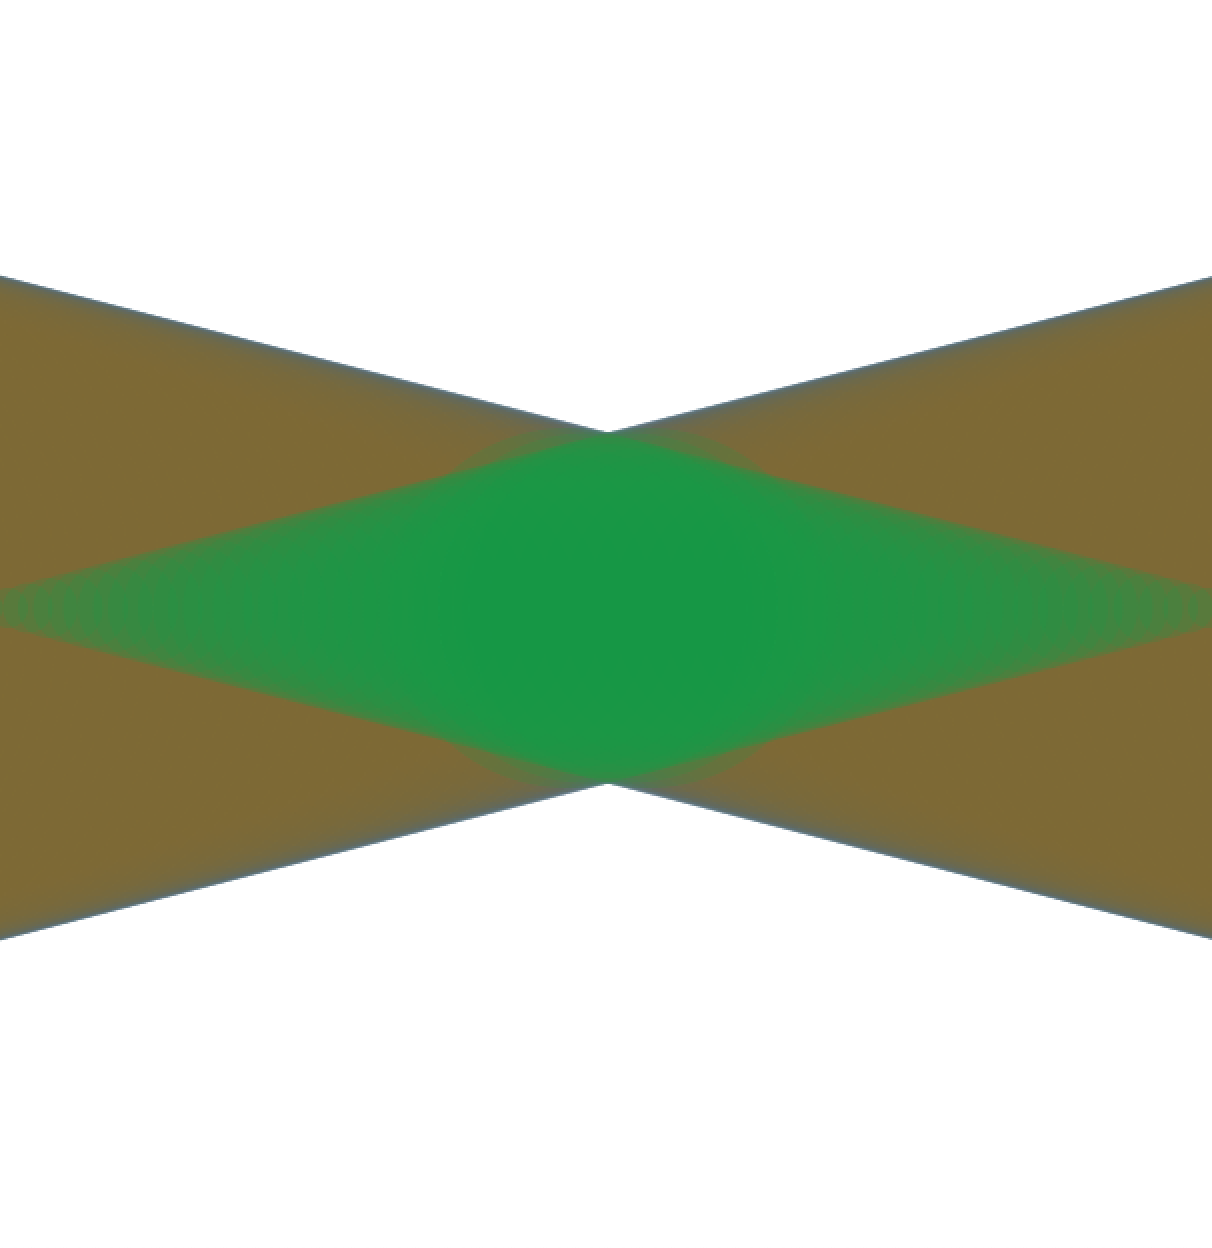
In the playback, I created two spheres that clash with each other and disappear off the screen. Then, I removed the stroke and played with random colors. The outcome was unexpected 🙂 Yeah, it was fun.
The Exhibition!
I combined the intro to the interlude and the playback with a few tweaks. Yeah, and a little suspense, :).
Final Work
Challenges
The first challenge I faced was bouncing the ball off the walls. For some reason, my method was not working after putting my function into a class. I tried multiple times to let a function inside a class run continuously but couldn’t get it to work. I spent hours learning how to make functions within classes run more than one time. Oh no! All this while, I’ve been thinking too hard, I just needed to add an if statement to my method.
Also, I was having trouble tweaking the randomness.Striking a balance between control over the elements and randomness was hard. I did a lot of trial and error in the beginning to find the optimal, the just-right level of randomness
Finally, Ripple! one big thing I learned from this assignment is to let go, I stopped controlling the background colors, and boom! there goes this mesmerizing art.
I have a deep fascination for the Butterfly Effect so of course when it was mentioned in class, I wanted to take my assignment’s concept from it.
I started off with very high expectations. My idea was that I wanted something to represent the universe, and a butterfly flapping in front of it. But I quickly found out that to recreate a galaxy or something similar, I would pretty much have to copy reference code from somewhere.
I started experimenting on my own, and thought that beziers and curves might be useful. Curves served my purpose well enough, but I could not control them to cover the whole height of the screen like I had wanted. So, I settled on lines.
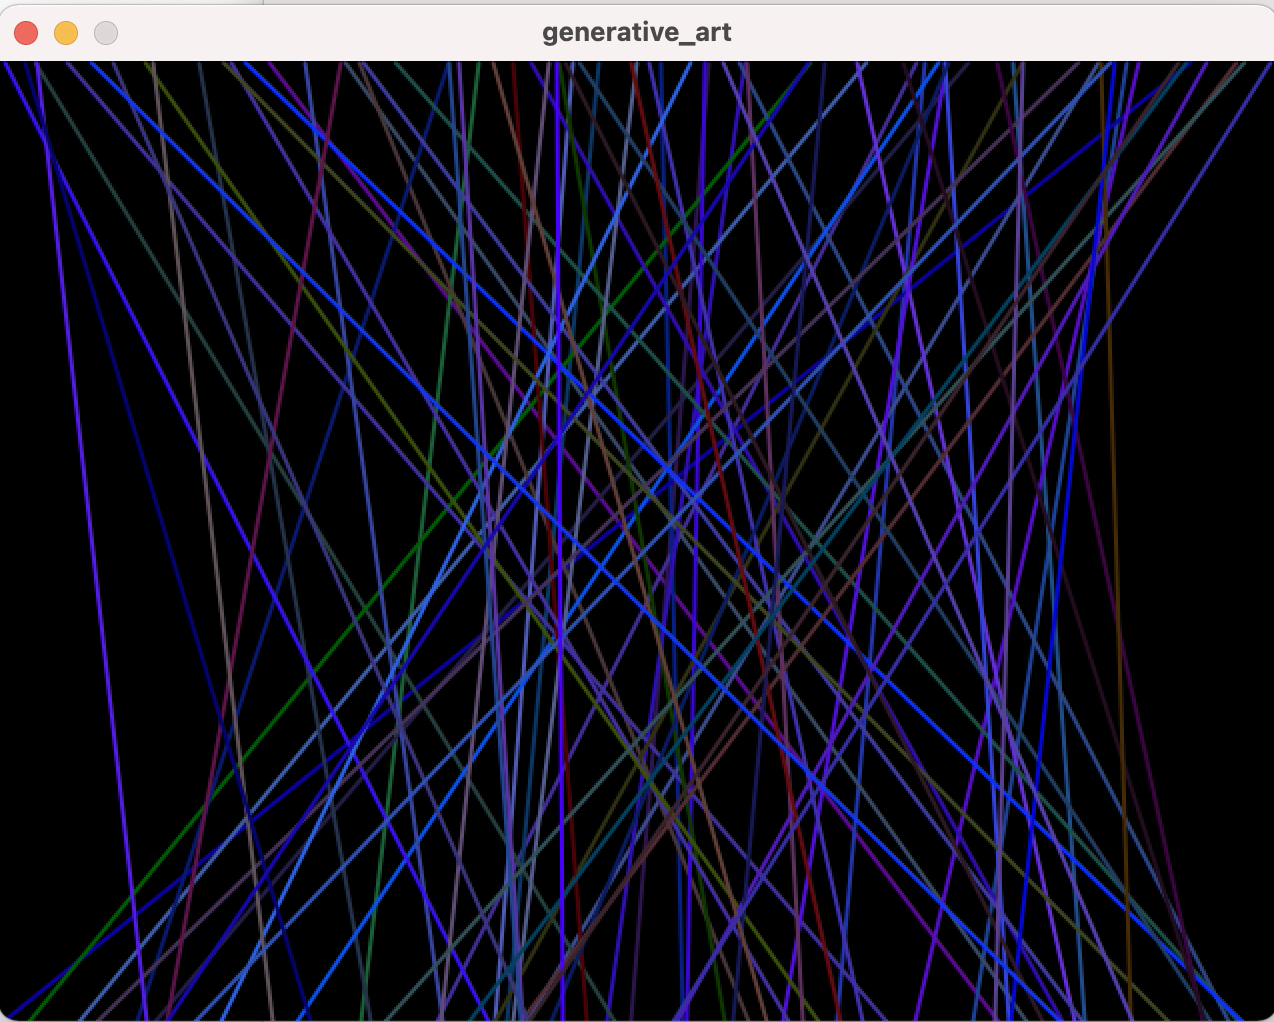
Now, I wanted to use noise to make it dynamic, but noise meant equal distances, and I wanted more chaos to represent the universe. So, I ended up with random. I had been drawing lines in the main sketch, but I realised they could be objects too. Here is my Line class. In another more complex version, it could have more functionality.
class Line{

  float _x1;
  float _x2;
  color col;

  Line(){
    _x1 = random(width);
    _x2 = random(width);
    col= color(random(100), random(100), random(255)); //more in the spectrum of blues to resemble galaxies
  }
}
I also restricted the colour scale to a more blue-heavy tone because that reminds me of the universe. Here is the drawing with a static photo of the lines:
All lined up
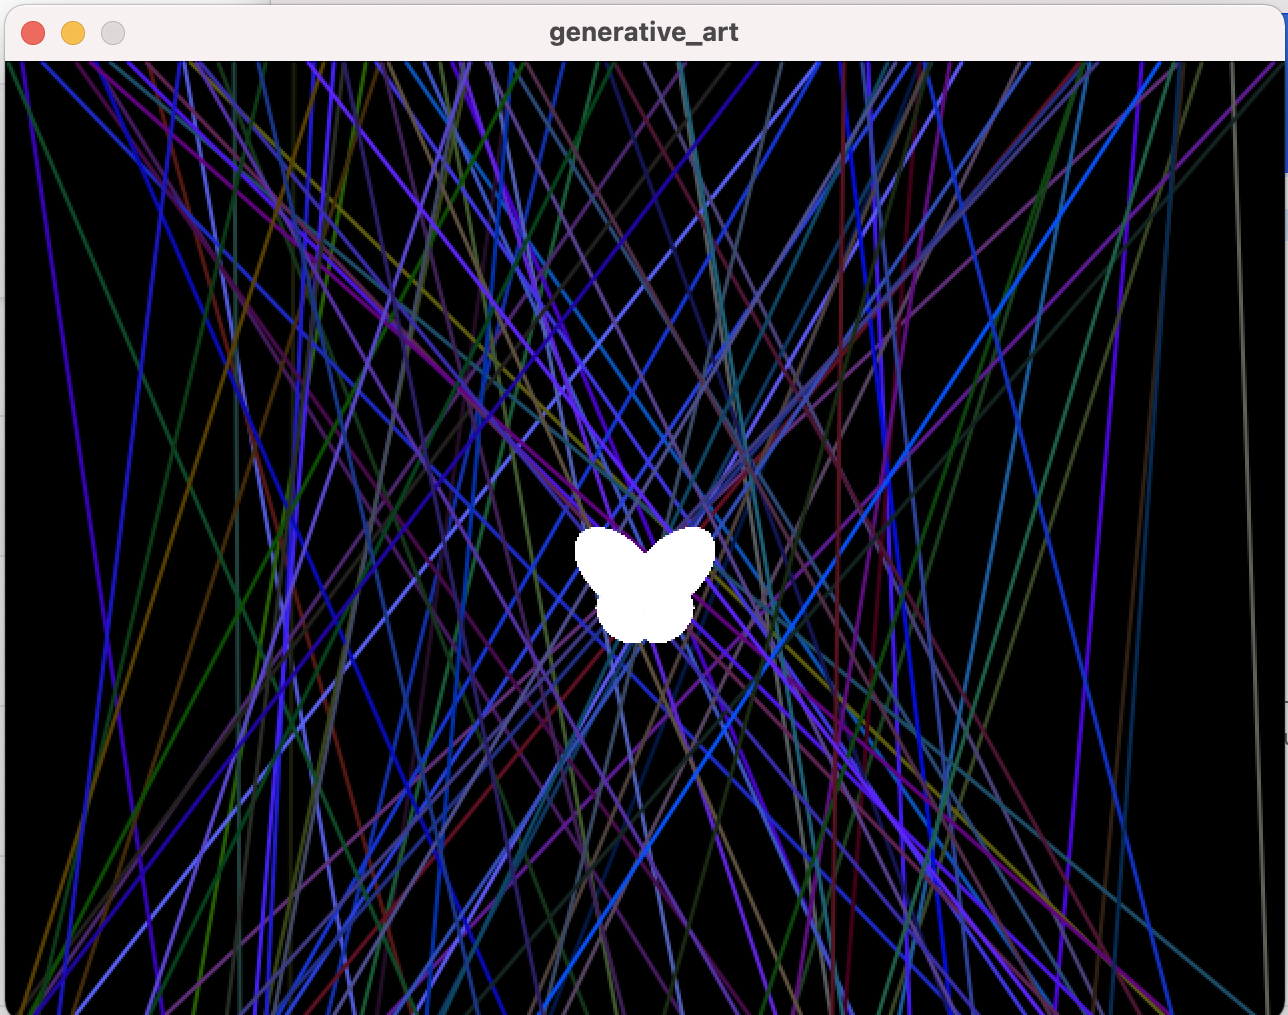
Then, I wanted the butterfly to be a class of its own too so that in variations, more butterfly objects could be inserted easily. In my vision for this drawing, I wanted it to be a white butterfly right in the middle of the screen. I used only ellipses, leaving out the “stick” of the body to make it look more stylistic. I used the translate(), rotate() and pushMatrix() and popMatrix() functionalities. The only thing left to figure out was the flapping itself, and I tried a couple of approaches. First I tried to change the rotation every few seconds (using frameCount) but that was looking too stilted and it didn’t look like flapping at all. I ended up just changing the heights and widths of the wings to give the illusion of movement. It’s still not perfect, but it’s better than what I thought was possible. My initial plan had also been that the flapping would change the noise and bring change on the screen, but since I used random I couldn’t do that.
Here’s a comparison with one of my early trials with noise and the final version:
How it startedYou never know where your choices will lead you
And here’s a video of the movement:
The main sketch ended up looking like:
int num_lines = int(random(75, 100));
Line[] lines = new Line[num_lines]; //array of Line objects
Butterfly butterfly = new Butterfly(); //Butterfly object

void setup(){
  size(640, 480);
}

void draw(){
  background(0);

  for(int i =0; i<num_lines; i++)
  {
    lines[i]=new Line();
    strokeWeight(2);
    stroke(lines[i].col);
    line(lines[i]._x1, 0, lines[i]._x2, 480); //drawing top to bottom lines
    butterfly.draw(); //the butterfly with flapping effect will automatically be drawn on top
  }

}
Overall, it ended up much different from the whimsical space-y theme I wanted, and seems more representative of the string theory or something in the background.
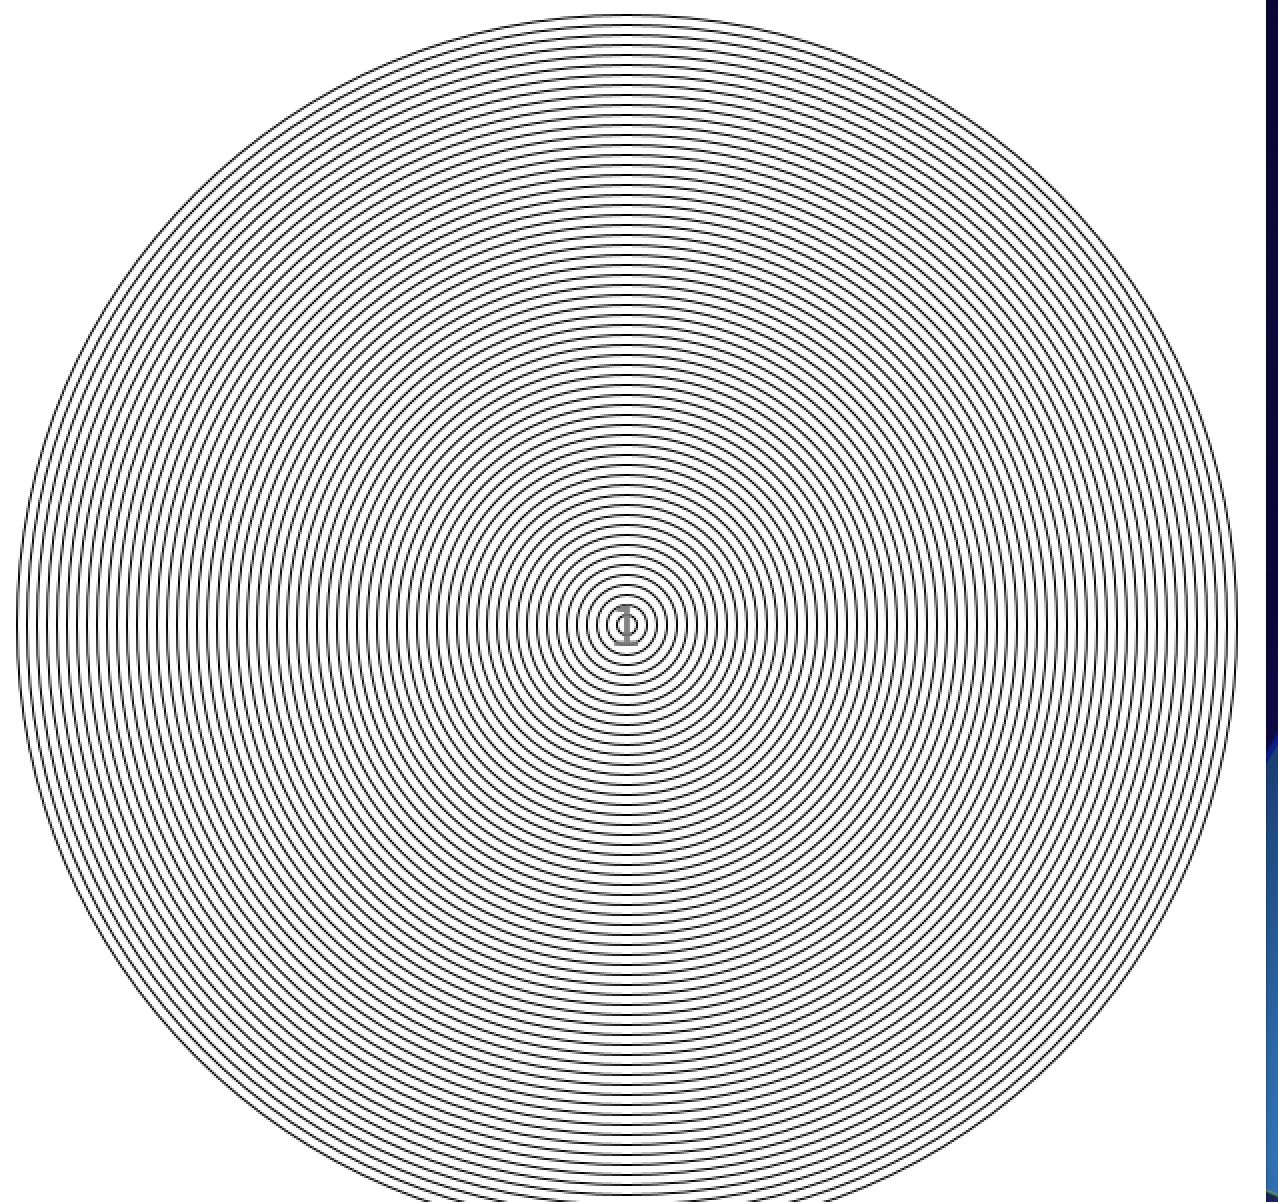
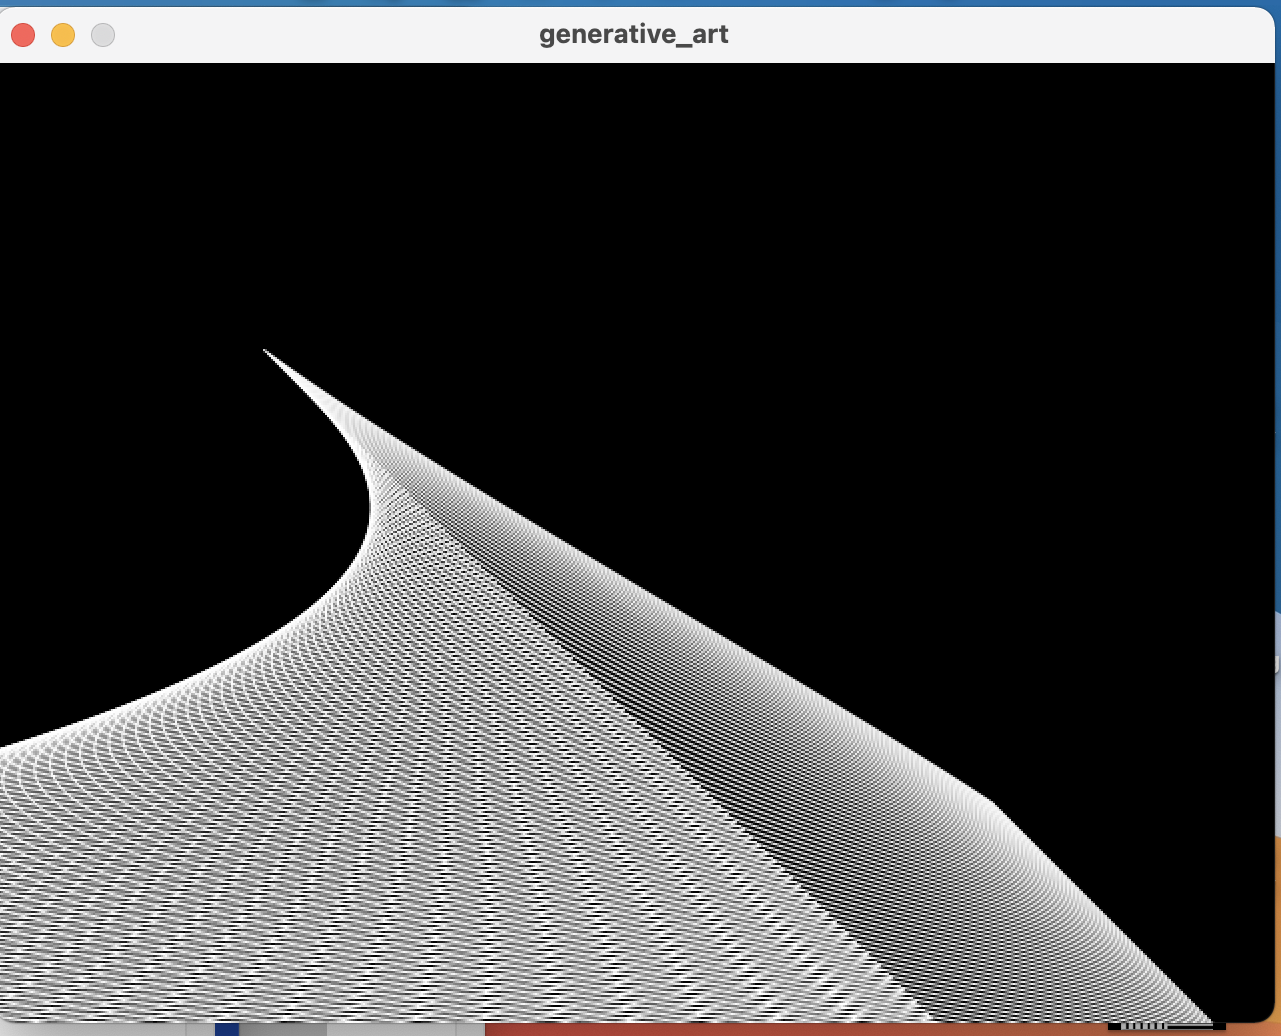
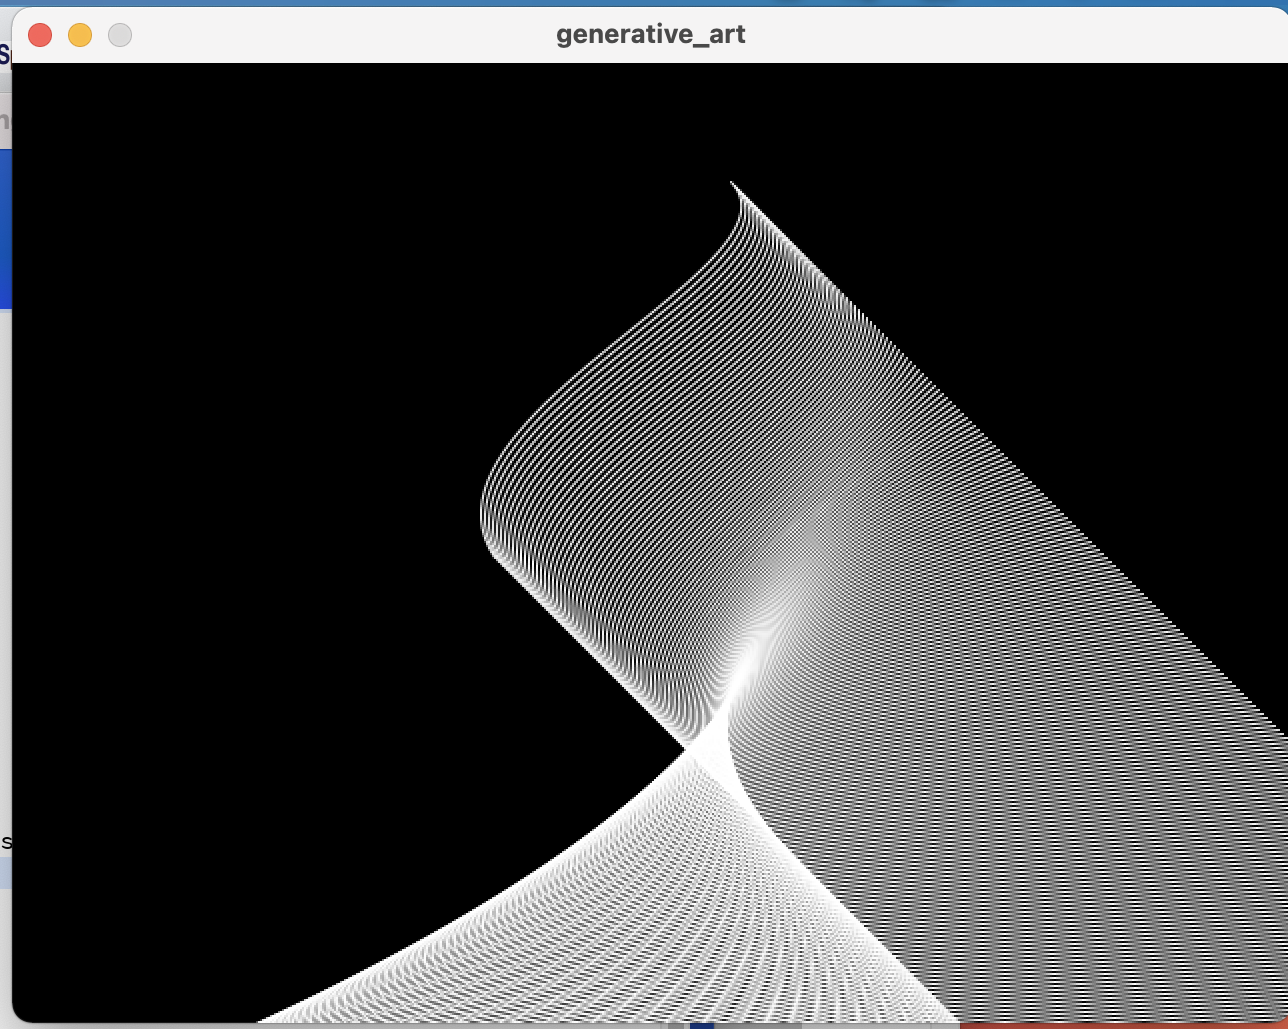
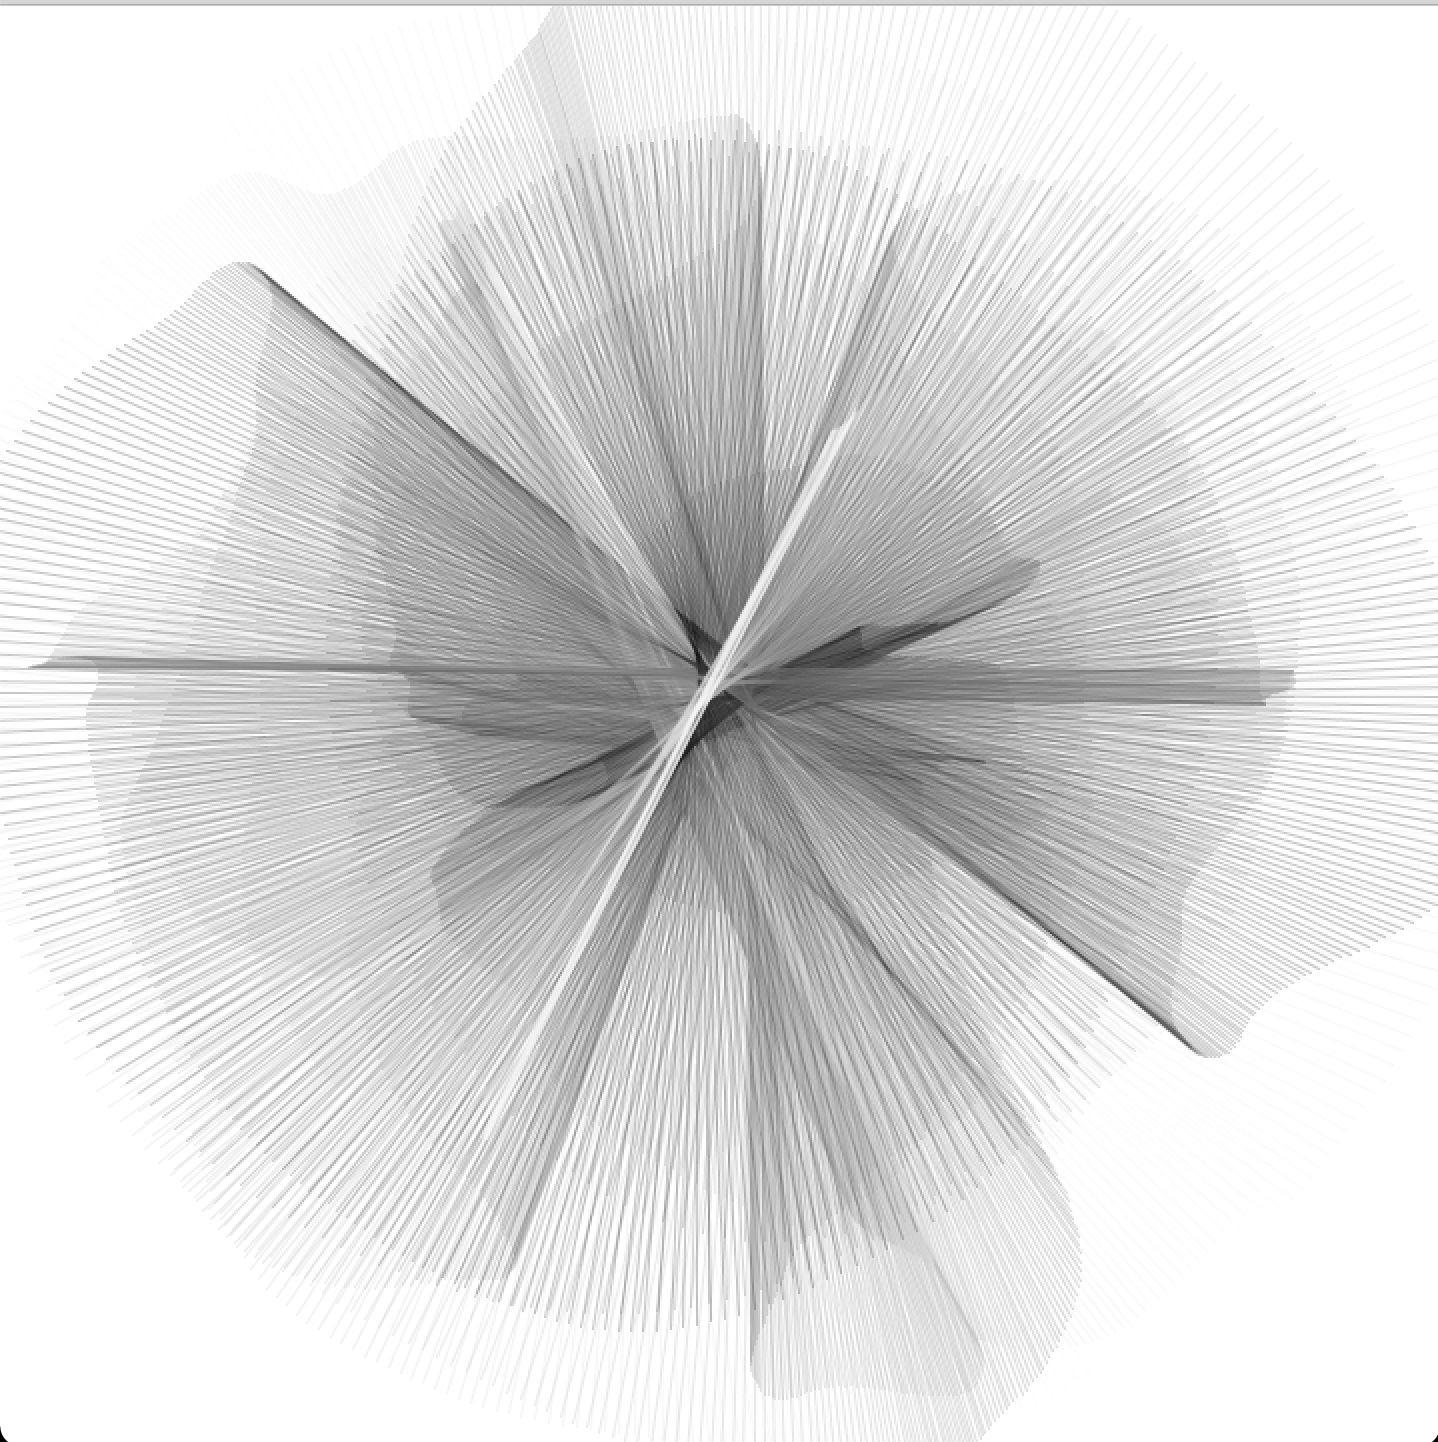
For this week’s assignment, I created a generative artwork using Object-Oriented Programming. Using mainly lines, I played around with Perlin noise to create a wavy circle.
I used variables and functions to create that. I started by sketching the circle and then draws a line from one point to the other. I computed the reverse by adding pi to the actual angle that turns 180° if you use radians. The two circumference points were then extrapolated using the identical sine and cosine methods.
The circle was smooth. I’ve added a few lines to change the color of the stroke.
I defined a variable StrokeCol, began with 255 (white), and decreased every frame by 1 up to 0. (black). Then I reversed the procedure to an endless level of 255.
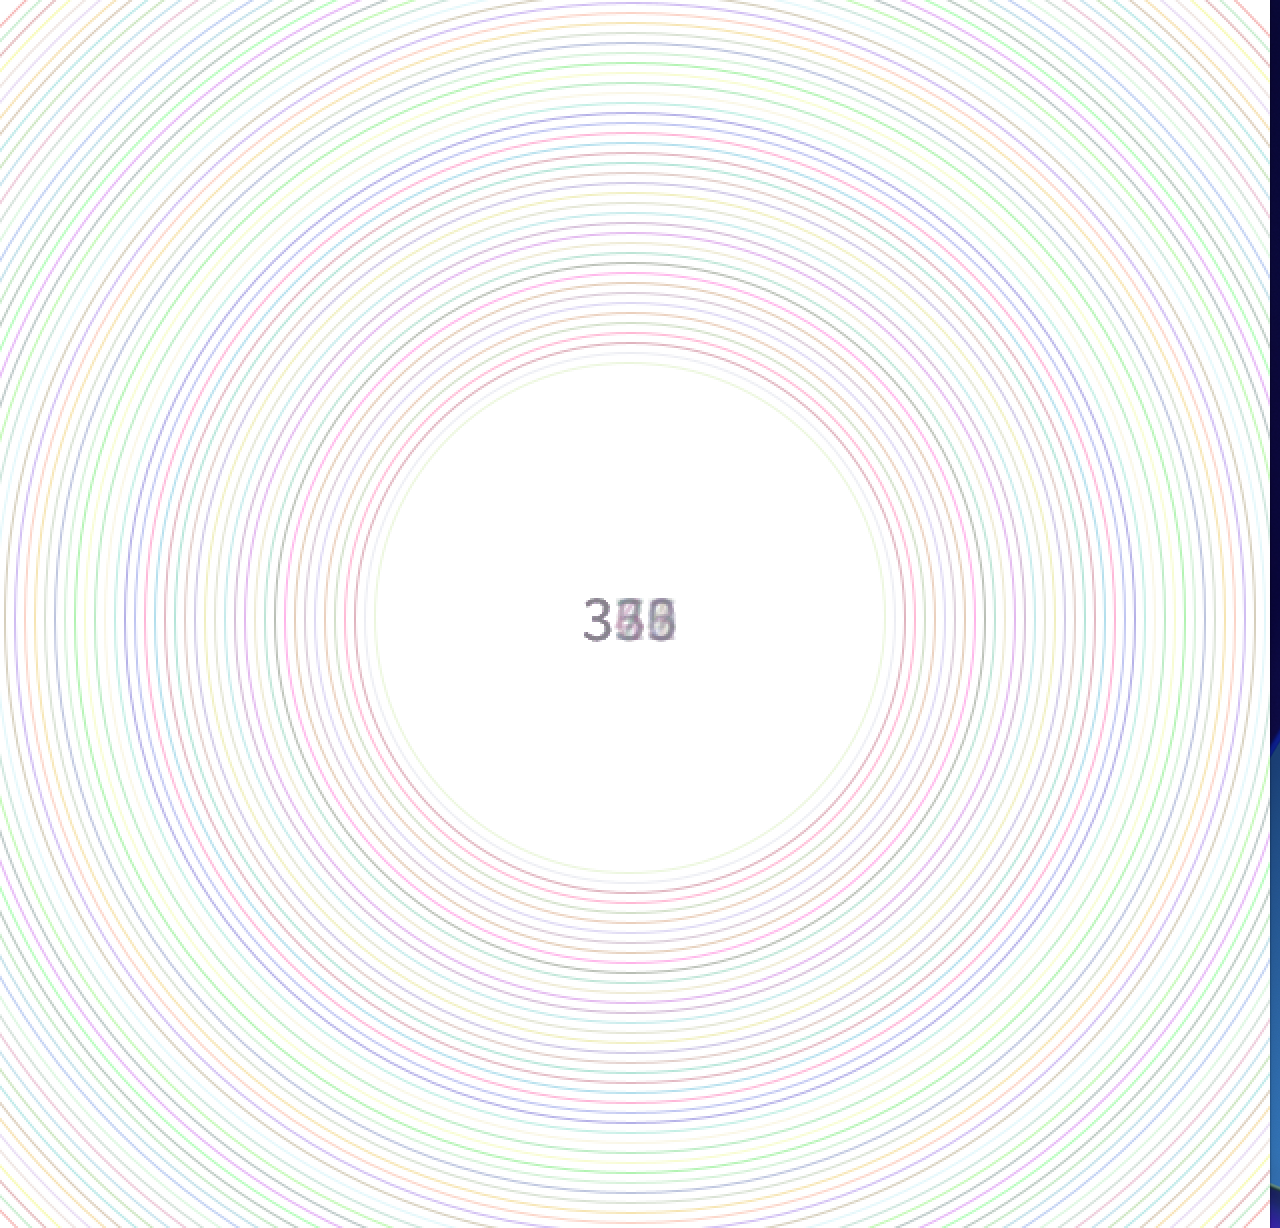
Next, I changed the length of the connection line by changing the radius with a noise value.
Then, to change it a little more, I added noise to its angle. I allowed the angle to be increased or decreased so that it could reverse.
Furthermore, I changed the center of the circle to give it a better effect.
This is what it looked like.
I have attached the video below:
The code of the above art is below:
//defining the variables
float angle_noise;
float radius_noise;
float x_noise;
float y_noise;
float angle = -PI/2;
float radius;
float strokeCol = 255;
int strokeChange = -1;
//initialising the setup
void setup() {
 size(720, 720);
 smooth();
 frameRate(30);
 background(255);
 noFill();

//using random values to use it further in the code
 angle_noise = random(10);
 radius_noise = random(10);
 x_noise = random(10);
 y_noise = random(10);

}
void draw() {

 radiusVar();

 angularSpin();

 circleProp();

}
//the radius function that changes the radius using perlin noise
void radiusVar(){
 radius_noise += 0.005;
 radius = (noise(radius_noise) * 550) + 1 ;
}
//using noise for angular spin
void angularSpin(){
 angle_noise += 0.005;
 angle += (noise(angle_noise) * 6) - 3;
 if (angle > 360) { angle -= 360; }
 if (angle < 0) { angle += 360; }
}
//defining the properties of the circle
void circleProp(){
 x_noise += 0.01;
 y_noise += 0.01;
 float centerX = width/2 + (noise(x_noise) * 100) - 50;
 float centerY = height/2 + (noise(y_noise) * 100) - 50;

 float radius_ = radians(angle);
 float x1 = centerX + (radius * cos(radius_));
 float y1 = centerY + (radius * sin(radius_));

 float oppradius = radius_ + PI;
 float x2 = centerX + (radius * cos(oppradius));
 float y2 = centerY + (radius * sin(oppradius));
 //changing the color of the stroke
 strokeCol += strokeChange;
 if (strokeCol > 254) { strokeChange = -1; }
 if (strokeCol < 0) { strokeChange = 1; }
 stroke(strokeCol, 60);
 strokeWeight(1);
 line(x1, y1, x2, y2);

}